-
E-mail
bjhtwc@163.com
-
Phone
18618396246
-
Address
No. 86 Wanxing Road, Changyang, Fangshan District, Beijing
Product Categories
Beijing Aerospace Weichuang Equipment Technology Co., Ltd


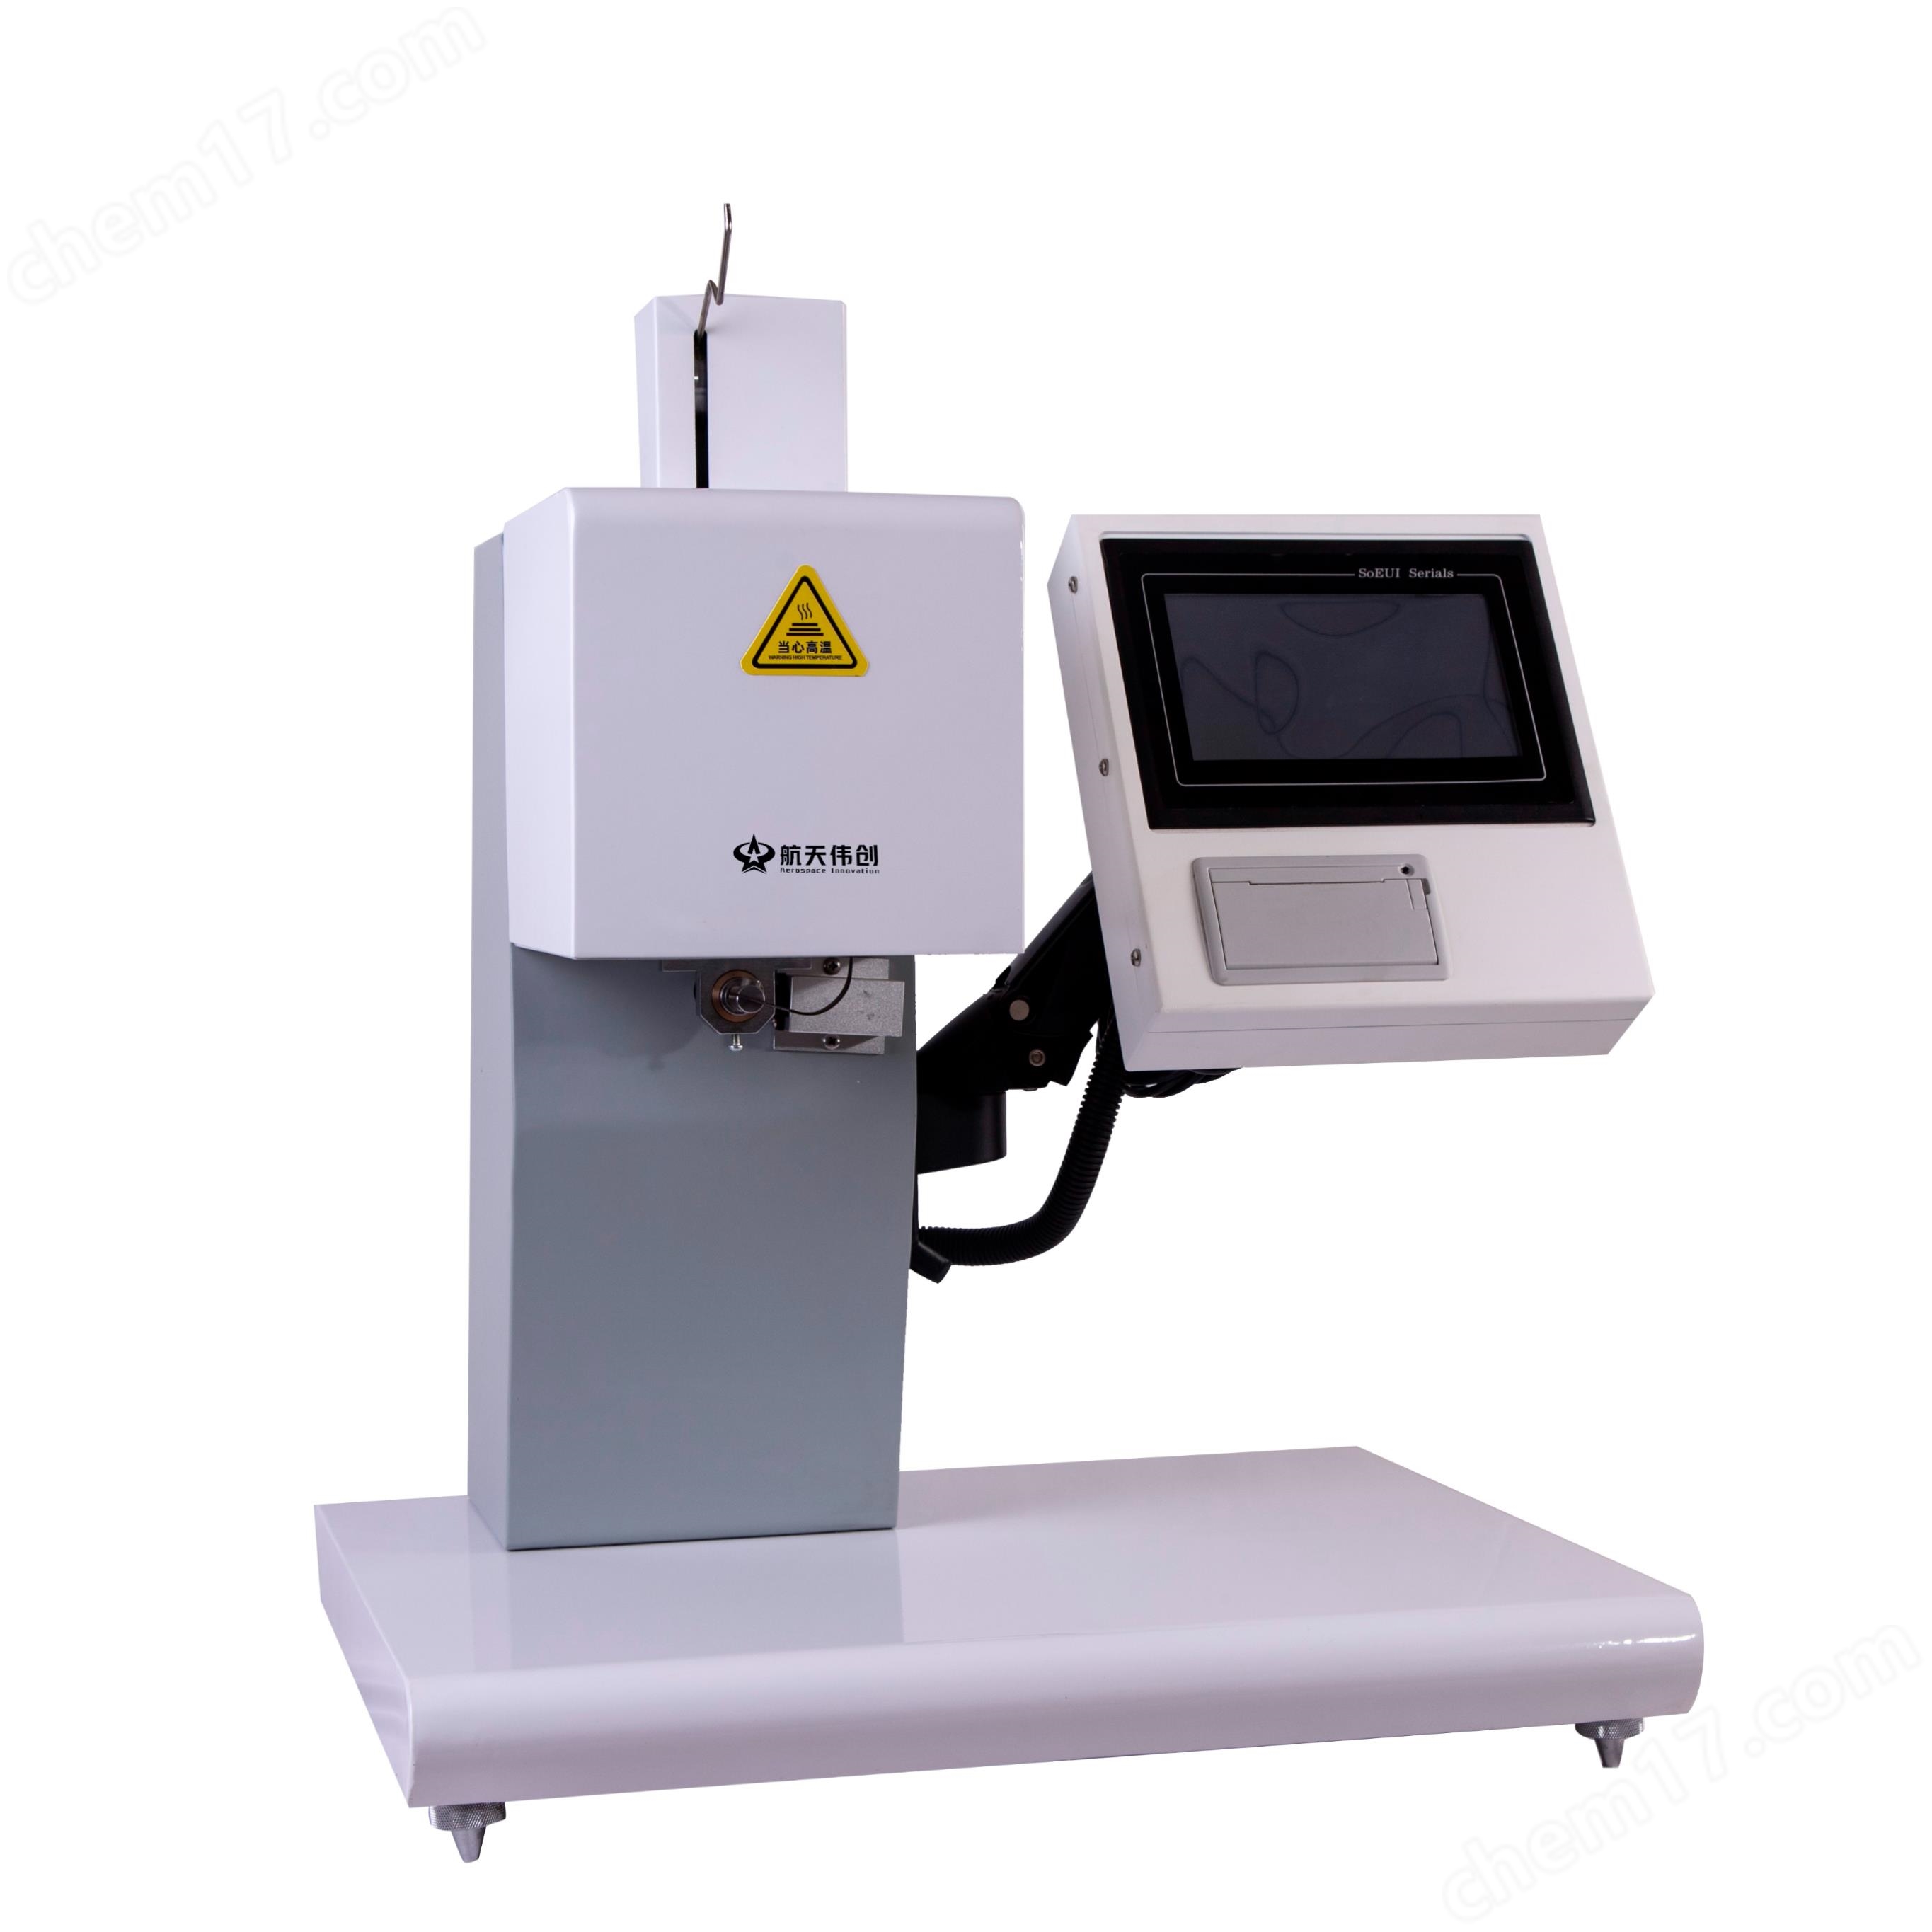
Rubber dielectric constant and dielectric loss tangent tester for vulcanized rubber
NegotiableUpdate on 01/12
- Model
- Nature of the Manufacturer
- Producers
- Product Category
- Place of Origin
Overview
The LDJD-B tester for dielectric constant and dielectric loss tangent of vulcanized rubber uses the Q-table method to test the dielectric constant and dielectric loss factor of vulcanized rubber.
Product Details
Introduction
The so-called dielectric constant (ε) refers to the ratio of the capacitance Cx of an insulating material polarized under the action of an electric field and the vacuum capacitance C0 of the same shape and size when there is a dielectric between the capacitor plates. The loss angle (δ) refers to the residual angle between the current vector and voltage vector flowing through a dielectric under an alternating electric field (power factor angle φ). The tangent of the loss angle (tan δ), also known as the dielectric loss factor, refers to the value of the tangent of the dielectric loss angle.
The test method for determining the dielectric constant and dielectric loss tangent of vulcanized rubber can be carried out in accordance with GB/T1693-2007 "Methods for determining the dielectric constant and dielectric loss tangent of vulcanized rubber".
Test electrode
-
electrode material

-
Electrode size
(1) Plate shaped sample electrode
1) Method A: Plate shaped sample electrode as shown in the figure.

Electrode configuration of plate-shaped sample
1- Measuring electrode 2- Protective electrode 3- Sample 4- High voltage electrode

Plate shaped sample electrode size (unit: mm)
2) Method B: Adopt a two electrode system. The electrode size is equal to the sample size, or the electrode size is smaller than the sample size. The electrode diameter of the plate-shaped sample is 38.0mm ± 0.1mm, 50.0mm ± 0.1mm, and 70.0mm ± 0.1mm.
(2) Tubular sample electrode
1) Method A: The tubular sample electrode is shown in the figure.
![]()

![]() Tube shaped sample electrode configuration (power frequency)
Tube shaped sample electrode configuration (power frequency)
1- Protective electrode 2- Measuring electrode 3- High voltage electrode 4- Sample

2) Method B: The electrode configuration of the tubular sample is shown in the figure. The electrode length of the tubular specimen is 50.0mm ± 0.1mm or 70.0mm ± 0.1mm.

Tube shaped sample electrode configuration (high frequency) 1- Sample 2- Upper electrode 3- Lower electrode
Electrode device
When conducting high-frequency testing, support electrodes can be used according to the testing frequency and requirements. When the frequency is greater than or equal to 1MHz and less than 10MHz, microelectrodes should be used; When the frequency is greater than or equal to 10MHz, use a support electrode.

Bracket electrode

Microelectrode measurement
test instrument
Method A:
1) The testing instrument is a power frequency high-voltage bridge, and its schematic diagram is shown in the figure.
![]()

Schematic diagram of power frequency voltage bridge
![]()
T - Test Transformer Cs - Standard Capacitor Cx - Sample
R3- Variable resistor C2, C4- Variable capacitor
R4- Fixed resistor G - Bridge balance indicator P - Discharge device
2) Measurement range: Loss tangent (tan δ) is 0.001-1; The capacitance (C) is between 40 and 2000 pF.
3) Measurement error of bridge: The measurement error shall not exceed 10%. When the sample tan δ is less than 0.001, the measurement error shall not exceed 0.001, and the measurement error of capacitance shall not exceed 5%. The tan δ of standard capacitors should be less than 0.0001.
4) The bridge must have a good shielding grounding device.
Method B:
There are two types of testing instruments for method B: one is the resonance boosting method (Q-meter), and the other is the transformer sodium method.
1) The schematic diagram of the resonance boosting method (Q-table) is shown in the figure.The instrument adoptsRubber dielectric constant and dielectric loss tangent tester for vulcanized rubberLDJD-B。
① Measurement range: frequency from 10kHz to 160MHz, capacitance from 30 to 540pF, Q value from 1 to 1000.

Schematic diagram of resonance rise method (Q-table)
A - ammeter Rt - coupling resistance L - auxiliary coil C - standard capacitor
Cx - Sample V, V1- voltmeter (indicated by Q position)
② Measurement error:Rubber dielectric constant and dielectric loss tangent tester for vulcanized rubberLDJD-BThe capacitance error is ± 1% C, and the Q value is ± 5%; The measurement error of the instruments is ± 10%.
2) The schematic diagram of the sodium substation method is shown in the figure.

Schematic diagram of sodium substation method
C - Adjustable capacitor L - Resonant coil Cr - Tube shaped fine-tuning capacitor
Cu - main capacitor Cx - sample
![]()
Similar Product Recommend