-
E-mail
wei.zhu@shuyunsh.com
-
Phone
17621138977
-
Address
Room 602, Building 3, G60 Science and Technology Innovation Cloud Corridor, Lane 288, Qianfan Road, Songjiang District, Shanghai
Product Categories
Shuyun Instrument (Shanghai) Co., Ltd


Auger electron spectrometer
NegotiableUpdate on 01/09
- Model
- Nature of the Manufacturer
- Producers
- Product Category
- Place of Origin
Overview
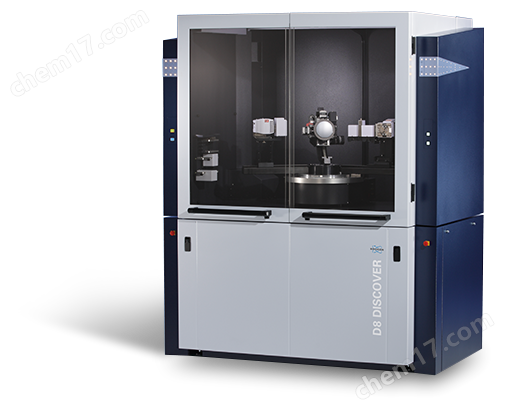
The PHI 710 Auger Electron Spectrometer from PHI Corporation is a high-performance Auger Electron Spectrometer (AES) instrument designed. This device can analyze the elemental and chemical state information of nanoscale feature regions, ultra-thin films, and multi-layer structure interfaces.
Product Details
PHI 710 from PHI CompanyAuger electron spectrometerIt is a high-performance Auger electron spectroscopy (AES) instrument designed. This device can analyze the elemental and chemical state information of nanoscale feature regions, ultra-thin films, and multi-layer structure interfaces. As a high spatial resolution, high sensitivity, and high energy resolution Auger electron spectrometer, PHI 710 can provide users with various analytical needs at the nanoscale.

Auger electron spectrometerPHI 710Key Features:
SEM resolution ≤ 3 nm, AES resolution ≤ 8 nm
In the process of collecting and analyzing Auger energy spectra, including spectra, depth analysis, and element distribution images, it is necessary to first define the sample analysis area on the SEM image, which inevitably requires a small and stable beam spot diameter. The spatial resolution of SEM images of PHI 710 is better than 3nm, and the spatial resolution of AES is better than 8nm (@ 20kV, 1nA), as shown in the following figure:

Figure 2 shows the interface analysis of ductile fracture in cast iron. The SEM image on the left, Auger imaging of calcium, magnesium, and titanium in the middle, and Auger imaging of sulfur on the right fully demonstrate the analytical ability of PHI 710 in chemical states at the nanoscale.
Auger electron spectrometer coaxial cylindrical mirror analyzer (CMA):

The coaxial geometric design of PHI's electronic equipment and analyzer has the characteristics of high sensitivity and unobstructed line of sight, which meets the demand for multi-faceted characterization capabilities of Auger analysis for complex samples in reality. As shown in the above figure, all Auger data is collected from various directions of particles, and there are no shadows in the imaging.
If the device is not equipped with a coaxial analyzer, the sensitivity of the instrument will decrease, and there will be shadows in the imaging. Some analysis areas may not be analyzed due to their location. If you want to achieve high sensitivity, you can only analyze the area directly facing the analyzer. As shown in the figure below, if it is necessary to analyze the back of particles and the area between particles, there will be shadows in the image.

Chemical state imaging of Auger electron spectrometer:
Atlas imaging
PHI710 can extract spectral information from each pixel in Auger imaging analysis, which enables chemical state imaging.
High energy resolution Auger component image
The following figure shows the analysis of semiconductor chip testing, with Si as the tested element. By performing linear least squares (LLS) fitting on the Auger image of Si, the Auger spectra clearly reflect the regions of three different chemical states of Si, namely elemental silicon, silicon nitride oxide, and metallic silicon. The corresponding Auger spectra of Si can be extracted from them, as shown in the third row of the three figures.

Nano scale thin film analysis
In the SEM image below, there are defects on the nickel thin film on the silicon substrate, which is due to the formation of silicon nickel compounds at the interface after annealing. An analysis point was set in both the defect area and the normal area, under high-energy resolution mode (0.1%), with an electron beam diameter of 20nm and an ion device set at 0.5kV, as shown in the following figure. In the Multiplak software, the small two multiplication fitting method was used to distinguish between metal nickel and silicon nickel compounds, as well as metal silicon and silicides. It can be seen that silicon nickel compounds only exist at the interface, and do not exist in the nickel thin film layer and silicon substrate. However, silicon nickel compounds were found at the defects of the nickel coating.

PHI SmartSoft AES user interface:PHI SmartSoft is a software designed based on user needs. This software guides users to import samples, define analysis points, and set analysis conditions in a task oriented manner, allowing beginners to quickly and conveniently test samples, and users can easily repeat previous measurements.

PHI Multiplak data processing software:The Multiplak software has a comprehensive Auger energy spectrum database. Spectral analysis, line scan analysis, imaging, and depth analysis data can all be processed using the Multiplak. The powerful functions of the software include peak localization, extraction of chemical state information and detection limits, quantitative testing, and image enhancement.

Optional accessories:
1. In situ sample storage platform in vacuum chamber;
2. In situ brittle fracture;
3. Vacuum transfer tube;
4. Pre extraction room navigation camera;
5. Electronic energy dispersive detector (EDS);
6. Electron backscatter diffraction detector (EBSD);
7. Backscattered Electron Detector (BSE);
8. Focused Ion Beam (FIB);
Application areas of Auger electron spectrometer:
• Semiconductor devices: defect analysis, etching/cleaning residue analysis, short circuit problem analysis, contact contamination analysis, interface diffusion phenomenon analysis, packaging problem analysis, FIB device analysis, etc.
Display components: defect analysis, etching/cleaning residue analysis, short circuit problem analysis, contact pollutant analysis, interface diffusion phenomenon analysis, etc.
Magnetic storage devices: surface multilayer, surface element, interface diffusion analysis, pore defect analysis, surface contamination analysis, magnetic head defect analysis, residue analysis, etc.
Metal, alloy, glass, and ceramic materials: surface sediment analysis, clean pollutant analysis, intergranular grain boundary analysis, etc.