Foam aluminum is a kind of porous metal material that combines the properties of porous materials and metals. Due to its low density, high energy absorption performance and recyclability, it has broad application prospects in today's material field, and is a promising engineering material, especially in transportation, aerospace, building structures and other fields.
The team led by Professor Chen Fanxiu of Qingdao University of Science and Technology conducted an in-depth study on the mechanical properties of foam aluminum by using three-dimensional high-resolution X-ray micro CT from SANYING and supporting in-situ loading system. Through in-situ loading experiments on closed cell foam aluminum with densities of 0.217g/cm3, 0.347g/cm3, 0.414g/cm3 and 0.588g/cm3, the porosity, layer by layer porosity, pore size distribution and sphericity of foam aluminum with different densities were compared and analyzed. The effects of pore structure parameters on the mechanical properties and energy absorption properties of foam aluminum were investigated, and the differences in mechanical properties of foam aluminum with different densities were revealed.
1. Materials and Methods
1.1 Material Preparation
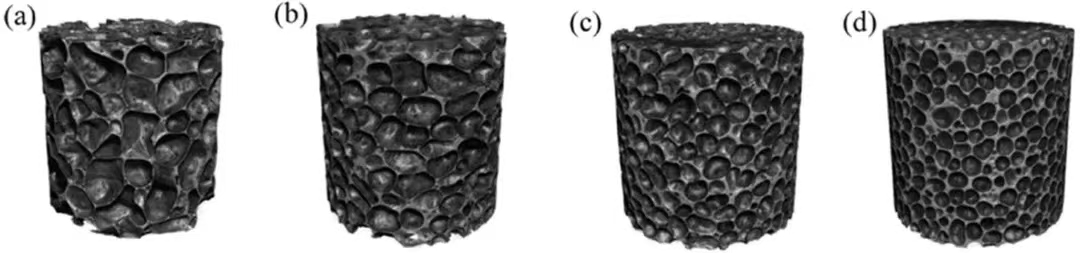
In this study, 1060 industrial pure aluminum is used as the base material, TiH2 is used as the foaming agent, and the melt foaming process is used to prepare closed cell foam aluminum materials with a size of Φ 30mm × 30mm as the research object. With the increase of foam aluminum density, the foam cells gradually decrease (Figure 1).
Figure 1 Four densities of foam aluminum cylindrical specimens:
(A) 0.217g/cm3,(B) 0.347g/cm3,(C) 0.414 g/cm3,(D) 0.588 g/cm3
1.2 Experimental Methods
NanoVoxel-2000 series high resolution X-ray three-dimensional micro CT produced by Tianjin Sanying Precision Instrument Co., Ltd. of China was used to conduct nondestructive scanning of foam aluminum cylindrical specimens with four densities and a resolution of 25.2 μ m.
Sanying Precision NanoVoxel-2000 Micro CT
Using reconstruction software for 3D reconstruction, obtain a 3D reconstructed image (Figure 2). At the same time, three-dimensional visualization software was used to analyze the porosity, layer by layer porosity and other pore structure parameters of foam aluminum.
Fig. 2 3D reconstruction image of foam aluminum with four densities
(A) 0.217g/cm³,(B) 0.347g/cm³,(C) 0.414 g/cm³,(D) 0.588 g/cm³
1.3 In situ loading test
Using the Micro CT in-situ loading system, uniaxial loading tests were conducted at a rate of 3mm/min in displacement loading mode. When the indenter just contacts the test piece, it is recorded as the initial time. At this time, micro CT scanning is used to record the initial shape of foam aluminum, and then CT scanning is performed every 3mm downward of the indenter. At the same time, the force displacement curve is obtained through data collection by supporting software, and the stress strain curve is calculated to evaluate the mechanical properties of closed cell foam aluminum.
Schematic diagram of Micro CT in-situ loading system: (A) Top view of pressure cylinder (B) Plan view of pressure cylinder (C) Pressure head of pressure device
2. Main achievements
2.1 Porosity and layer by layer porosity
CT scanning was performed on foam aluminum specimens with four densities, and the no-load porosity of four foam aluminum specimens was obtained by threshold segmentation method (Fig. 3 (a)). The layer by layer void ratio distribution of four kinds of foam aluminum is obtained through analysis. The drawing results in Figure 3 (b) show that the layer by layer void ratio distribution of foam aluminum with the same density in three directions of XY, XZ and YZ is basically consistent, and the layer by layer void ratio of four kinds of foam aluminum is roughly distributed in four intervals.
Figure 3 (a) Porosity of foam aluminum with four densities (b) Layer by layer porosity of different slices of foam aluminum with four densities
In order to further analyze the mechanical variability of foam aluminum with different densities, the void ratio of XY direction slice layer by layer in the process of uniform loading was compared and analyzed. Perform a CT scan on the specimen every 3 mm of compression, with a strain of 0.1. The results of the layer by layer porosity distribution of foam aluminum with four densities during compression (Fig. 4) show that the layer by layer porosity distribution curve shows a phenomenon of low at both ends and high in the middle, which is related to the foaming process and the shape of the test piece. During the process of increasing strain from 0 to 0.7, the collapse and deformation zone of the pores gradually formed.
Fig. 4 Layer by layer porosity of foam aluminum with four densities (A) 0.217g/cm ³, (B) 0.347g/cm ³, (C) 0.414g/cm ³, (D) 0.588g/cm ³
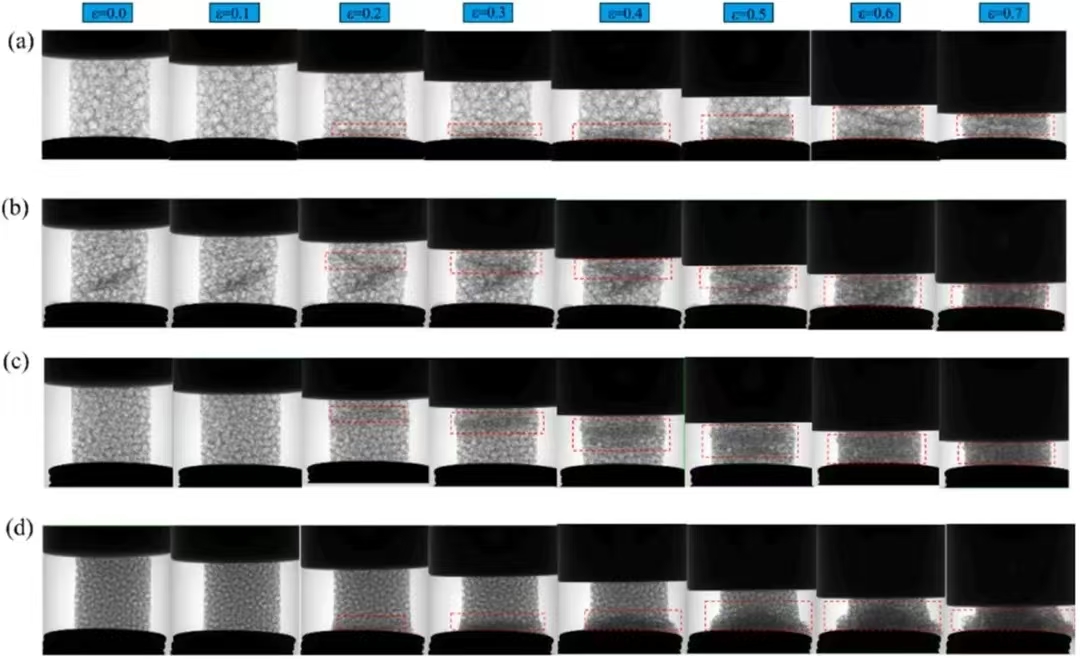
The collapse process of foam aluminum during loading (Fig. 5) shows that when the strain is 0.1, foam aluminum is in the elastic stage, and the structure almost has no change. foam aluminum slowly collapses with the increase of strain, and the cell morphology gradually changes. Bubble collapse usually starts from the weakest area and forms a local deformation zone, which gradually expands with increasing strain. When the strain is 0.7, the internal structure of foam aluminum has completely changed, especially the foam aluminum with the density of 0.58g/cm3 bears more pressure after loading, which eventually breaks and completely destroys, and its later collapse is more complete than the other three densities of foam aluminum.
Fig. 5 Collapse process of foam aluminum during loading (A) 0.217g/cm ³, (B) 0.347g/cm ³, (C) 0.414 g/cm ³, (D) 0.588 g/cm ³
2.2 Pore size distribution
Pore size distribution is another major factor affecting the mechanical properties and energy absorption of foam aluminum. The frequency and digital percentage distribution diagram of equivalent pore size of bubble holes obtained by watershed algorithm (Figure 6) shows that the number of pores of foam aluminum is mainly distributed in the small pores, and the curve rises slowly with the increase of equivalent pore size. The higher the density of foam aluminum, the smaller the range of equivalent pore size distribution. The range of equivalent pore size distribution of foam aluminum with density of 0.588g/cm3 is half smaller than that of foam aluminum with density of 0.217g/cm3, and the bubble shape is closer to spherical with the increase of density.
Fig. 6 Pore size distribution of foam aluminum with four densities
(A) 0.217g/cm³,(B) 0.347g/cm³,(C) 0.414 g/cm³,(D) 0.588 g/cm³
2.3 sphericity
Sphericity can measure whether the shape of the bubbles is standard. The watershed algorithm is used to segment the cell in foam aluminum, and the surface area and volume of each cell are calculated and counted. The scatter diagram of sphericity distribution of foam aluminum cell (Fig. 7) shows that the higher the density of foam aluminum, the denser the sphericity distribution, and the better the sphericity. An increase in porosity will be accompanied by the appearance of more irregular bubbles. The sphericity of the cell is related to the foaming and discharge phenomenon during the solidification of foam aluminum. The sphericity distribution of the four foam aluminum is mostly concentrated in the upper half, indicating that the structure of the prepared foam aluminum is relatively uniform.
Fig. 7 Sphericity Distribution Scatter Diagram of Four Density foam Aluminum Foams
(A) 0.217g/cm³,(B) 0.347g/cm³,(C) 0.414 g/cm³,(D) 0.588 g/cm³
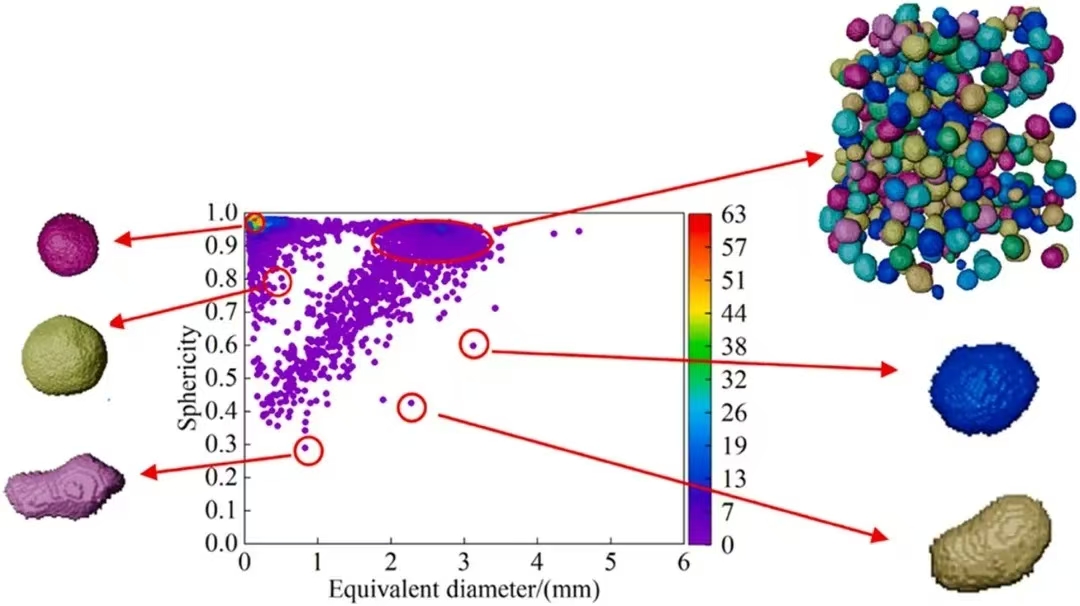
In order to see the change of cell shape more intuitively, take the typical cell of foam aluminum with a density of 0.588g/cm ³ as an example to draw a three-dimensional cell diagram (Figure 8). The results indicate that the shape of the bubbles is mostly spherical or ellipsoidal, with only a small portion having irregular shapes, indicating that the irregular bubbles formed by foaming have good sphericity.
Fig. 8 Three dimensional diagram of foam aluminum with density of 0.588g/cm ³
2.4 Stress strain relationship during in-situ loading process
Compress foam aluminum at a constant rate to ensure a constant strain rate during loading. The obtained stress-strain curve (Fig. 9) shows that the stress-strain curve of foam aluminum with higher density is at the top. The stress-strain curve is divided into three stages, namely the elastic stage, the stress plateau stage, and the densification stage. Among them, foam aluminum absorbs a large amount of energy in the stress plateau stage, and plastic deformation and collapse occur in the cell until the stress increases exponentially in the densification stage. This continuous collapse will affect the energy absorption of foam aluminum.
Fig. 9 Stress strain curve of foam aluminum with four densities
The main mechanical parameters of foam aluminum in the elastic stage are shown in Table 2: the yield stress of foam aluminum with a density of 0.588g/cm3 is nearly 7 times that of foam aluminum with a density of 0.217g/cm3, and the yield strain of four types of dense foam aluminum is relatively close. The elastic modulus of high-density foam aluminum is large, and the maximum difference is about 5 times.
Table 2 Main mechanical parameters of foam aluminum in elastic stage
2.5 Energy absorption during in-situ loading process
The energy absorption capacity and energy absorption efficiency of foam aluminum with four densities are calculated as a function of stress and strain (Fig. 10). The drawing results show that the energy absorption and strain of foam aluminum are close to the positive linear relationship. The higher the density of foam aluminum is, the stronger the energy absorption capacity is; The more uniform the structure, the higher the energy absorption efficiency of foam aluminum; The three stages of energy absorption efficiency changing with stress correspond to the three stages of stress-strain curve: slow rise zone (elastic stage), sharp rise zone (stress plateau stage), and decreasing weakening zone (densification stage). Among them, the stress plateau stage is the key stage that affects the energy absorption efficiency of bubbles and is also the key stage of bubble energy absorption deformation.

Figure 10 Energy absorption and energy absorption efficiency of foam aluminum with four densities: (a) Energy absorption under different strains (b) Energy absorption efficiency under different strains (c) Energy absorption under different stresses (d) Energy absorption efficiency under different stresses (σ D: densification stress, ε D: densification strain)
By comparing the mechanical properties of four foam aluminum with different densities (Table 3), it is found that the platform stress, density stress and energy absorption capacity under density strain increase with the increase of foam aluminum density. The densification strain of foam aluminum with density of 0.588g/cm3 is the largest, and that of 0.347g/cm3 is the smallest. The pore structure parameters of the specimen determine the mechanical variability of foam aluminum with different densities, such as mechanical properties, energy absorption properties, etc.
Table 3 Comparison of mechanical properties of foam aluminum with different densities
Conclusion
In this study, Micro CT was used to scan foam aluminum with different densities, and the pore structure parameters (porosity, layer by layer porosity, pore size distribution and sphericity), mechanical properties and energy absorption of foam aluminum with different densities under in-situ loading were analyzed.
The main research results can be summarized as follows: the collapse of foam aluminum pores in the field loading test starts from the high porosity area; High density foam aluminum has low porosity, small pores and good sphericity; The stress-strain curve of high-density foam aluminum is located above, and its elastic modulus is large; The energy absorption capacity is related to the density of foam aluminum, and the energy absorption capacity of foam aluminum with high density is large, but the energy absorption efficiency is mainly related to whether the structure is uniform.
Sanying Precision has always been dedicated to X-ray CT imaging technology and product development, committed to providing users with new methods and tools to solve problems, and will continue to provide stronger assistance to researchers in the future!