-
E-mail
yangli@top17.net
-
Phone
19032001373
-
Address
No. 182 Xijiu Road, Gongshu District, Hangzhou City, Zhejiang Province
Product Categories
Zhejiang Top Cloud Agriculture Technology Co., Ltd
Mobile single axis gantry phenotype acquisition and analysis system
NegotiableUpdate on 12/20
- Model
- Nature of the Manufacturer
- Producers
- Product Category
- Place of Origin
Overview
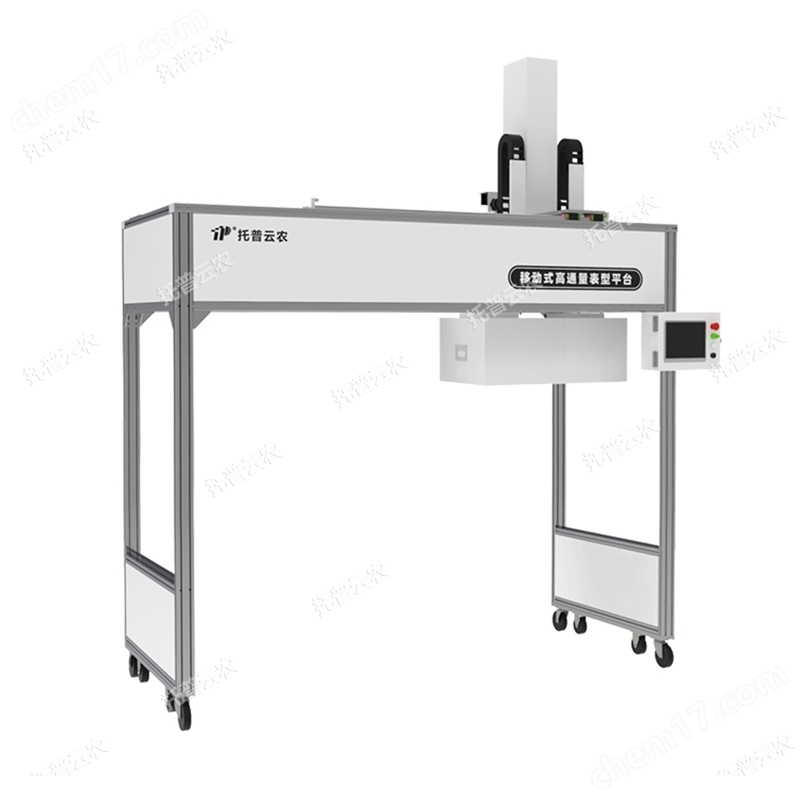
The mobile single axis gantry phenotype acquisition and analysis system is designed for the needs of plant phenotype identification under indoor, field, or greenhouse conditions. It is a high-throughput platform that integrates plant phenotype image acquisition and analysis functions. Adopting a simplified design form of a single axis small gantry, which can be manually pushed, the imaging sensor can automatically move and locate to the plant area and hover above the plant, and automatically adjust the camera for imaging acquisition and phenotype analysis according to the height of the plant; The central imaging unit supports the configuration of multiple types of imaging sensors to improve acquisition efficiency; Support hardware size customization, effectively ensuring high compatibility between the platform and construction requirements.
Product Details
1、 Product Introduction
Top Cloud AgricultureMobile single axis gantry phenotype acquisition and analysis systemIt is a high-throughput phenotype platform designed for in situ phenotype identification of plants under indoor or greenhouse conditions, integrating image acquisition and analysis functions. It can integrate visible light cameras, depth cameras, hyperspectral and infrared thermal imaging units to achieve the collection and analysis of plant "morphology structure physiology thermal dynamics" phenotype data. Suitable for various scenarios such as growth research, stress response, and disease research in experimental applications.
2、 Model difference
model |
Functional differences |
TP-MPR-I2 |
Configure visible light+depth imaging unit |
TP-MPR-I3 |
Configure visible light+depth imaging+hyperspectral imaging unit |
TP-MPR-I4 |
Configure visible light+depth imaging+hyperspectral+infrared thermal imaging unit |
3、 Core functional highlights
1. Simplified single axis gantry design
Lightweight gantry structure: adopting a single axis gantry design, the structure is concise and compact, supporting manual pushing, and easy to move flexibly indoors or in greenhouse environments.
Hover positioning and automatic height adjustment: The imaging unit can accurately move and hover above the plant, automatically adjust the camera position according to the height of the plant, and achieve adaptive image acquisition.
Single axis operation: The entire imaging unit is controlled by software to move smoothly in both horizontal and vertical directions.
2. Data collection
Multiple imaging units are optional: supporting the configuration of visible light, depth cameras, hyperspectral cameras, and infrared thermal imaging units, comprehensively collecting plant morphology, structure, physiology, and thermal dynamic information.
Infrared thermal imaging analysis: It can detect the temperature of plant leaves and surface, calculate the average temperature of the canopy, generate temperature distribution maps, and intuitively reflect the heat exchange status of crops.
3. Automated phenotype analysis
Automated parameter analysis: Built in crop analysis model algorithm, automatically analyzes multiple crop phenotype parameters and physiological parameters based on imaging module.
4. Integrated intelligent control
Full color touch screen: equipped with a 10.1-inch full-color LCD touch screen, real-time display of device status, operation information, and alarm messages.
Remote control: Users can remotely control the imaging unit through software for automated acquisition, analysis, and data management, supporting task timing and periodic execution.
ROI selection analysis: supports automatic or manual ROI region selection and analysis of images, comparing hyperspectral reflectance information and physiological changes distribution in different regions.
5. Visual Data Management
Data visualization and management: Support the visualization display of measurement data, historical data can be queried according to various conditions, and analysis results can be exported as charts.
6. System security guarantee
System security design: Real time monitoring and alarm, equipped with safety protection devices such as limit devices, emergency stop buttons, and fault alarms to ensure the safe and stable operation of equipment.
Data Security Storage: Data is automatically stored locally using a secure transmission mode, supporting unlimited storage space expansion to ensure data privacy and integrity.
7. Customizable extension
Meteorological environment monitoring (optional): Supports configuring meteorological sensors to monitor and record real-time environmental meteorological data such as temperature, humidity, and light intensity in the plant growth environment.
System customization: It can cooperate with user experiments to carry out requirement design, and develop plant algorithms and indicator analysis customized according to different crops.
4Mobile single axis gantry phenotype acquisition and analysis systemMain technical parameters
1. Visible Light&Depth Imaging Unit
RGB image pixels: 8 million
Imaging resolution: 3840 x 2160@5 /15fps
2. Hyperspectral imaging unit
Imaging method: Push scan imaging
Imaging wavelength range: 400~1000nm
Spectral resolution: 2.5nm
Spectral channels: ≥ 1200
Spectral pixel: 5.86 μ m * 5.86 μ m
Detector: CMOS
Image resolution: ≥ 1920 * 1920
Light source: Low frequency flash high light quality halogen lamp light source
3. Infrared thermal imaging unit
Detector type: Unit infrared detector
Response wavelength: shortwave
Thermal sensitivity/NETD: ≤ 40mK
Spectral range: 7.5 μ m~14 μ m
Infrared resolution: 640 * 512
Temperature measurement range: -20 ℃~+150 ℃, 0~650 ℃
Accuracy: ± 2 ℃ or ± 2% of the reading, whichever is greater
Frame rate: 25Hz
4. Single axis gantry mobile platform
Platform dimensions: length, width, and height 2.7m * 1.1m * 2.9m
Measurable height: Plants with a height of ≤ 1m
Platform size: customizable
Working environment: Temperature 0-50 ℃, humidity ≤ 90% RH
Similar Product Recommend


