-
E-mail
info@giantforce.cn
-
Phone
18911365393
-
Address
1311, Building B, Wanda Plaza, No. 58 Xinhua West Street, Tongzhou District, Beijing
Juli Optoelectronics (Beijing) Technology Co., Ltd
Deep analysis of the impact of spectral mismatch on precise testing of perovskite solar cells
Date: 2025-09-12Read: 35
For precise measurement of perovskite solar cells, stacked and multi junction solar cells, spectral mismatch of solar simulators is one of the key factors that must be considered.
Evaluating the impact of spectral mismatch on the testing of perovskite solar cells requires a combination ofTheoretical quantificationandexperimental verificationBy conducting targeted analysis of the deviation patterns of key parameters, the dependence of material properties, and the repeatability of testing, the sources and degrees of errors are ultimately identified. The following are specific evaluation methods and steps:
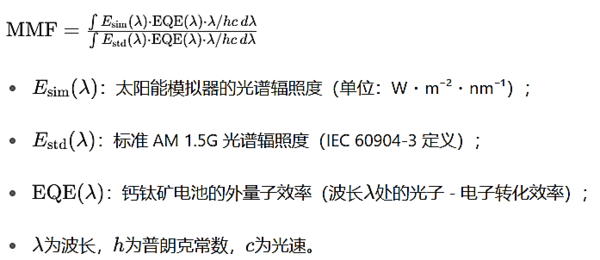
1、 Core Quantitative Indicator: Calculation of Spectral Mismatch Factor (MMF)
The Mismatch Factor (MMF) is a core parameter for evaluating the degree of spectral mismatch, and its physical meaning is the ratio of the short-circuit current of the battery under test conditions to the standard conditions (AM 1.5G), directly reflecting the impact of spectral mismatch on Jsc. The calculation formula is as follows:
Calculation steps and significance:
1. Measure key input data:
· Measure with a spectrometersunlightSimulators in the absorption band of perovskite (300-1000 nm, adjusted according to bandgap)Esim(λ);
· Measure the EQE of the battery(λ)(It is necessary to ensure the accuracy of EQE testing, especially near the absorption cutoff wavelength).
2. Calculate MMFIf: MMF=1 Indicating that the spectra match very well;
MMF>1 indicates that the simulator has high light intensity in the sensitive band of the battery, and the measured Jsc is overestimated;
If MMF<1, Jsc is underestimated.
3. Correct Jsc: ThroughJ sc,correction=Jsc,measurement×MMFEliminating the first-order error of spectral mismatch in Jsc is the basis for evaluation.
2、 Deviation analysis of key performance parameters
The impact of spectral mismatch needs to be quantified by comparing the "IV parameters under mismatched spectra" with the "theoretical/calibration values under standard spectra", and quantifying the deviation amplitude of each parameter:
1. Deviation of short-circuit current density (Jsc)
· Direct deviationCalculate theoretical deviation through MMF(ΔJ sc=J sc,measurement−Jsc,correction), and calculate the relative deviation(ΔJ sc/J sc,correction×100%).
· Judgment suggestion: AAA levelsunlightThe relative deviation of the simulator in the perovskite absorption band (300-800 nm) is as follows:>15% indicates severe spectral mismatch.
· Wavelength dependent verificationBased on the EQE curve, the positioning deviation mainly comes from the frequency band. For example, if the EQE peak is higher at 500 nm and the simulator 500 nm intensity is lower than the standard spectrum, then this band is the main cause of Jsc deviation.
2. Open circuit voltage (Voc) deviation
· Measure Voc under different spectral conditions (such as changing the spectral distribution of the simulator through a filter to maintain consistent total light intensity), and calculate the relative deviation(ΔVoc/Voc,correction×100%).
· Analysis pattern: If the short wave (<500 nm) light intensity is insufficient and causes a decrease in Voc, it indicates that the decrease in carrier concentration is the main cause; If the long wave is too strong and causes a decrease in Voc, it may be due to an increase in temperature (synchronous monitoring of battery temperature is required).
3. Linkage bias between fill factor (FF) and efficiency (PCE)
· Calculate the relative deviation of FF(ΔFF=(FFmeasurement−FFcorrection)/FFcorrection×100%)Among them, FF correctionRe calculate based on the corrected Jsc and Voc.
· PCE total deviation: ThroughΔPCE=(PCEmeasurement−PCEcorrection)/PCEcorrection×100%Assessment, ifThe deviation is significant,Then the spectrum needs to be recalibrated.
3、 Evaluation of Lag Effect and Repeatability
The hysteresis and repeatability effects of spectral mismatch on perovskite IV curves need to be verified through statistical analysis
Fluctuations in lag degree:
· Under the same simulator, repeatedly measure the IV curve of forward scan (from Voc to Jsc) and reverse scan (from Jsc to Voc), and calculate the hysteresis factor(HF=(PCEanti-sweep−PCEsweeping)/PCEanti-sweep×100%).
· Compare the HF distribution under different spectral conditions (such as replacing the simulator or adjusting the filter), and determine the relative standard deviation (RSD)largerThis indicates that spectral mismatch exacerbates hysteresis instability.
4、 Component dependency assessment (for different bandgap perovskites)
Due to the variation of the bandgap (absorption cutoff wavelength) of perovskite with composition, it is necessary to evaluate the differential effects of spectral mismatch:
1. Narrow bandgap perovskite (e.g. 1.2-1.4 eV, absorbed up to 900 nm):
· Focus on verifying the spectral matching of the 700-900 nm band, calculate the sub MMF of this band (integrating only 700-900 nm), and if the sub MMF deviateslargerThe total deviation of Jsc will significantly increase.

1. Wide bandgap perovskite (e.g. 1.6~1.8 eV, absorption up to 680 nm):
· Key verification of spectral matching in the 350-600 nm band, while monitoring Voc deviation. If the intensity fluctuation in this band causes Voc RSDlargerTargeted calibration is required.
2. comparative experiment: Use the same simulator to test perovskite with different bandgaps, draw the "bandgap parameter deviation" curve, and define the "sensitive wavelength range" of the simulator spectrum.
5、 Experimental verification: Control variable method and standard battery calibration
1. Controlled variable method:
· Maintain the total light intensity (100 mW/cm ²) constant, change the spectral distribution of the simulator by replacing the filter (such as short wave cut filter, long wave cut filter), and measure the changes in IV parameters.
· For example, after adding a 650 nm cut-off filter (removing>650 nm light), the Jsc of wide bandgap perovskite (absorbing up to 680 nm) should significantly decrease. If the decrease deviates from the EQE predictionlargerThis indicates that the original spectrum is mismatched in this band.
2. Standard battery comparison:
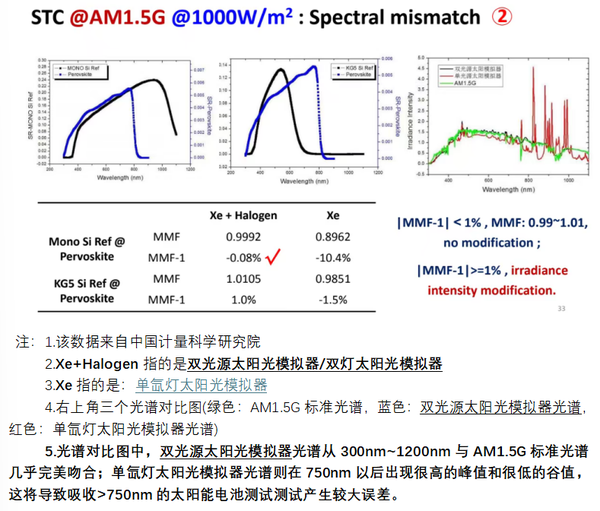
· Using certified perovskite standard cells (or reference cells with known performance), under testsunlightSimulators andHigh precision standardsunlightSimulators (such asDual lamp solar simulatorTheA+A+Grade A, spectral matching error<±10%(<± 5% is better)MS level))Test separately and compare parameter deviations.
· If to be testedsunlightThe Jsc of the simulator deviates from the standard valuelargerAnd even after MMF correction, it stilllargerIf so, the simulator spectrum needs to be recalibrated.
Summary: Evaluation Process and Qualification Standards
1. Calculate MMF and correct Jsc to ensure relative deviation of Jscsmall enough;
2. Analyze the chain bias of Voc, FF, PCE, and total PCE biassmall enough;
3. Verify lag factor and parameter repeatability,enableRSDsmall enough;
4. Evaluate spectral matching of sensitive bands and MMF deviation of sub bands for perovskite components (bandgap)small enough.
Through the above steps, the impact of spectral mismatch can be systematically quantified, providing a basis for the reliability of test data. For high-precision research, it is necessary to ensure that all indicators meet AAA standards/A+A+ATesting standards,namelyDual light source/Dual lamp solar simulatorIt is an ideal choice,And clearly report the MMF values and calibration methods in the paper.