-
E-mail
info@phenom-china.com
-
Phone
18516656178
-
Address
Room T5705, Shanghai Hongqiao Libao Plaza, No. 88 Shenbin Road, Hongqiao Town, Minhang District, Shanghai
Funa Scientific Instruments (Shanghai) Co., Ltd
Multidimensional characterization (Part 2) | Using scanning electron microscopy, CT and simulation to "see through" regenerated carbon fiber composite materials
Date: 2025-11-14Read: 0
Multi scale validation from in-situ experiments to numerical simulations
In situ tensile testing and SEM observation
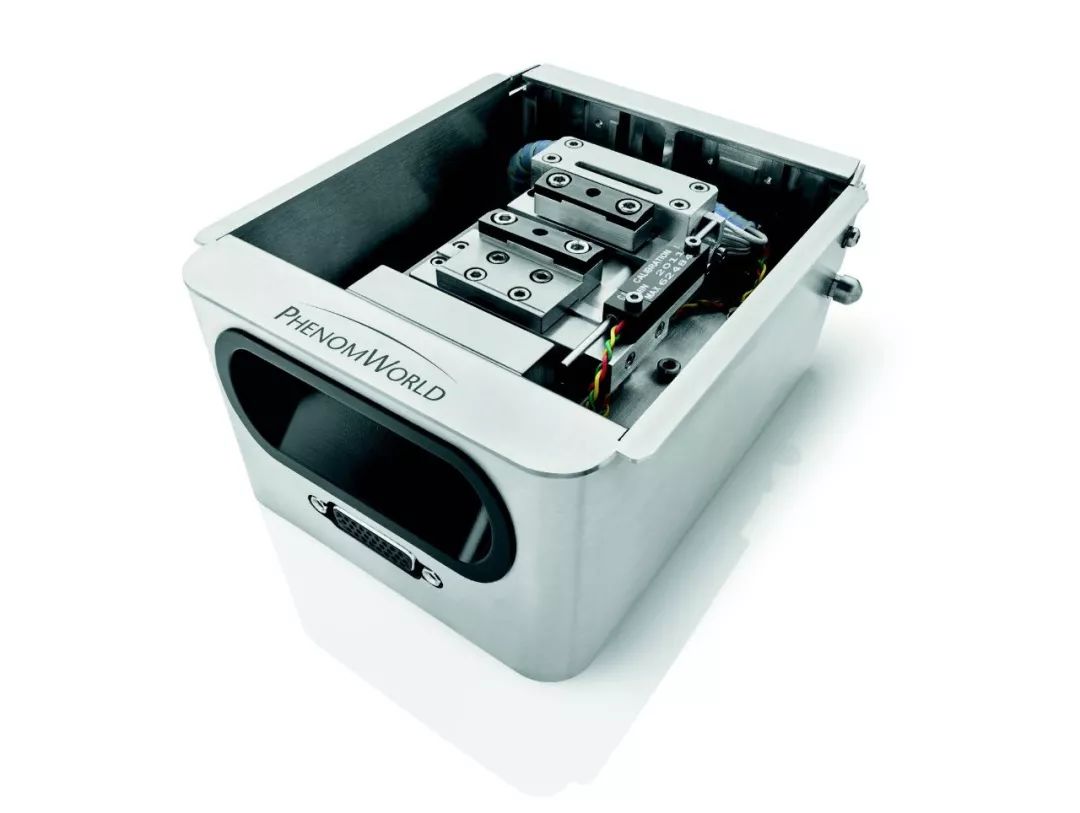
Use Phenom XL desktop scanning electron microscope combined with stretching sample stage to observe the stretching process in real time under low vacuum. The loading rate is 0.033mm/min, and the tension and displacement are recorded in real-time.
The results show that:
The stretching curve exhibits three stages: elastic stage, nonlinear stage, and rapid fracture stage;
The peak tensile force is about 158 N, corresponding to an elongation of 0.636 mm, followed by rapid failure;
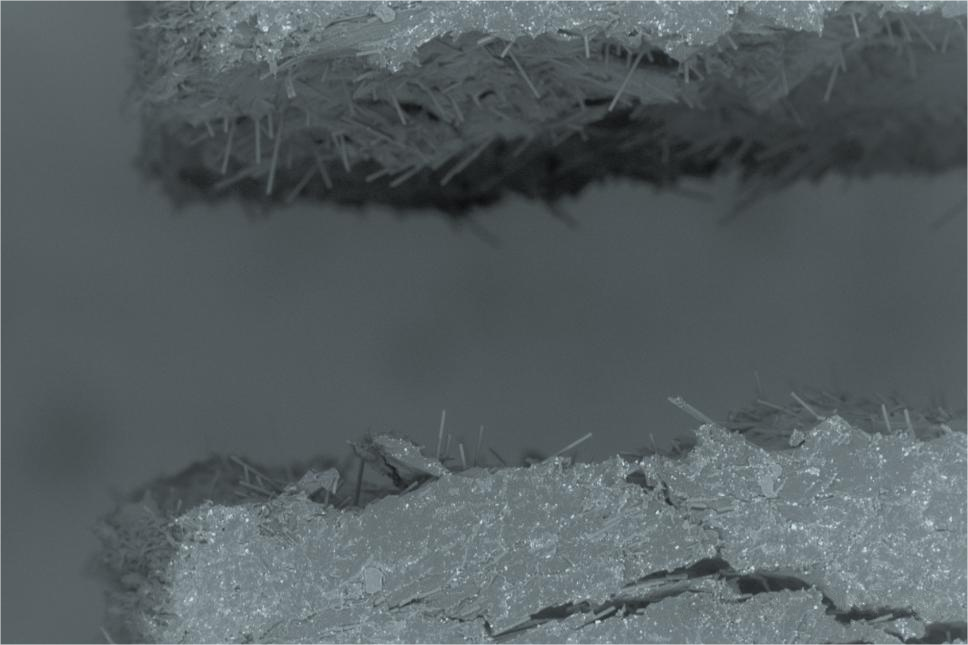
SEM video reveals the initiation and propagation process of microcracks, and fracture observation shows a large number of fibers pulling out and interface debonding, verifying the brittle fracture characteristics of the material.
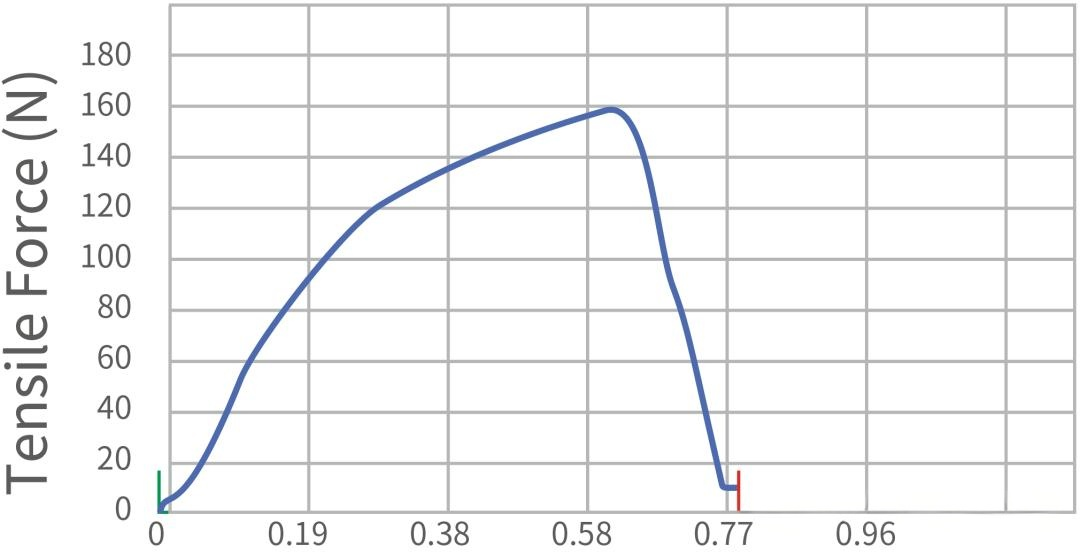
Figure 10: In situ tensile tension displacement curve
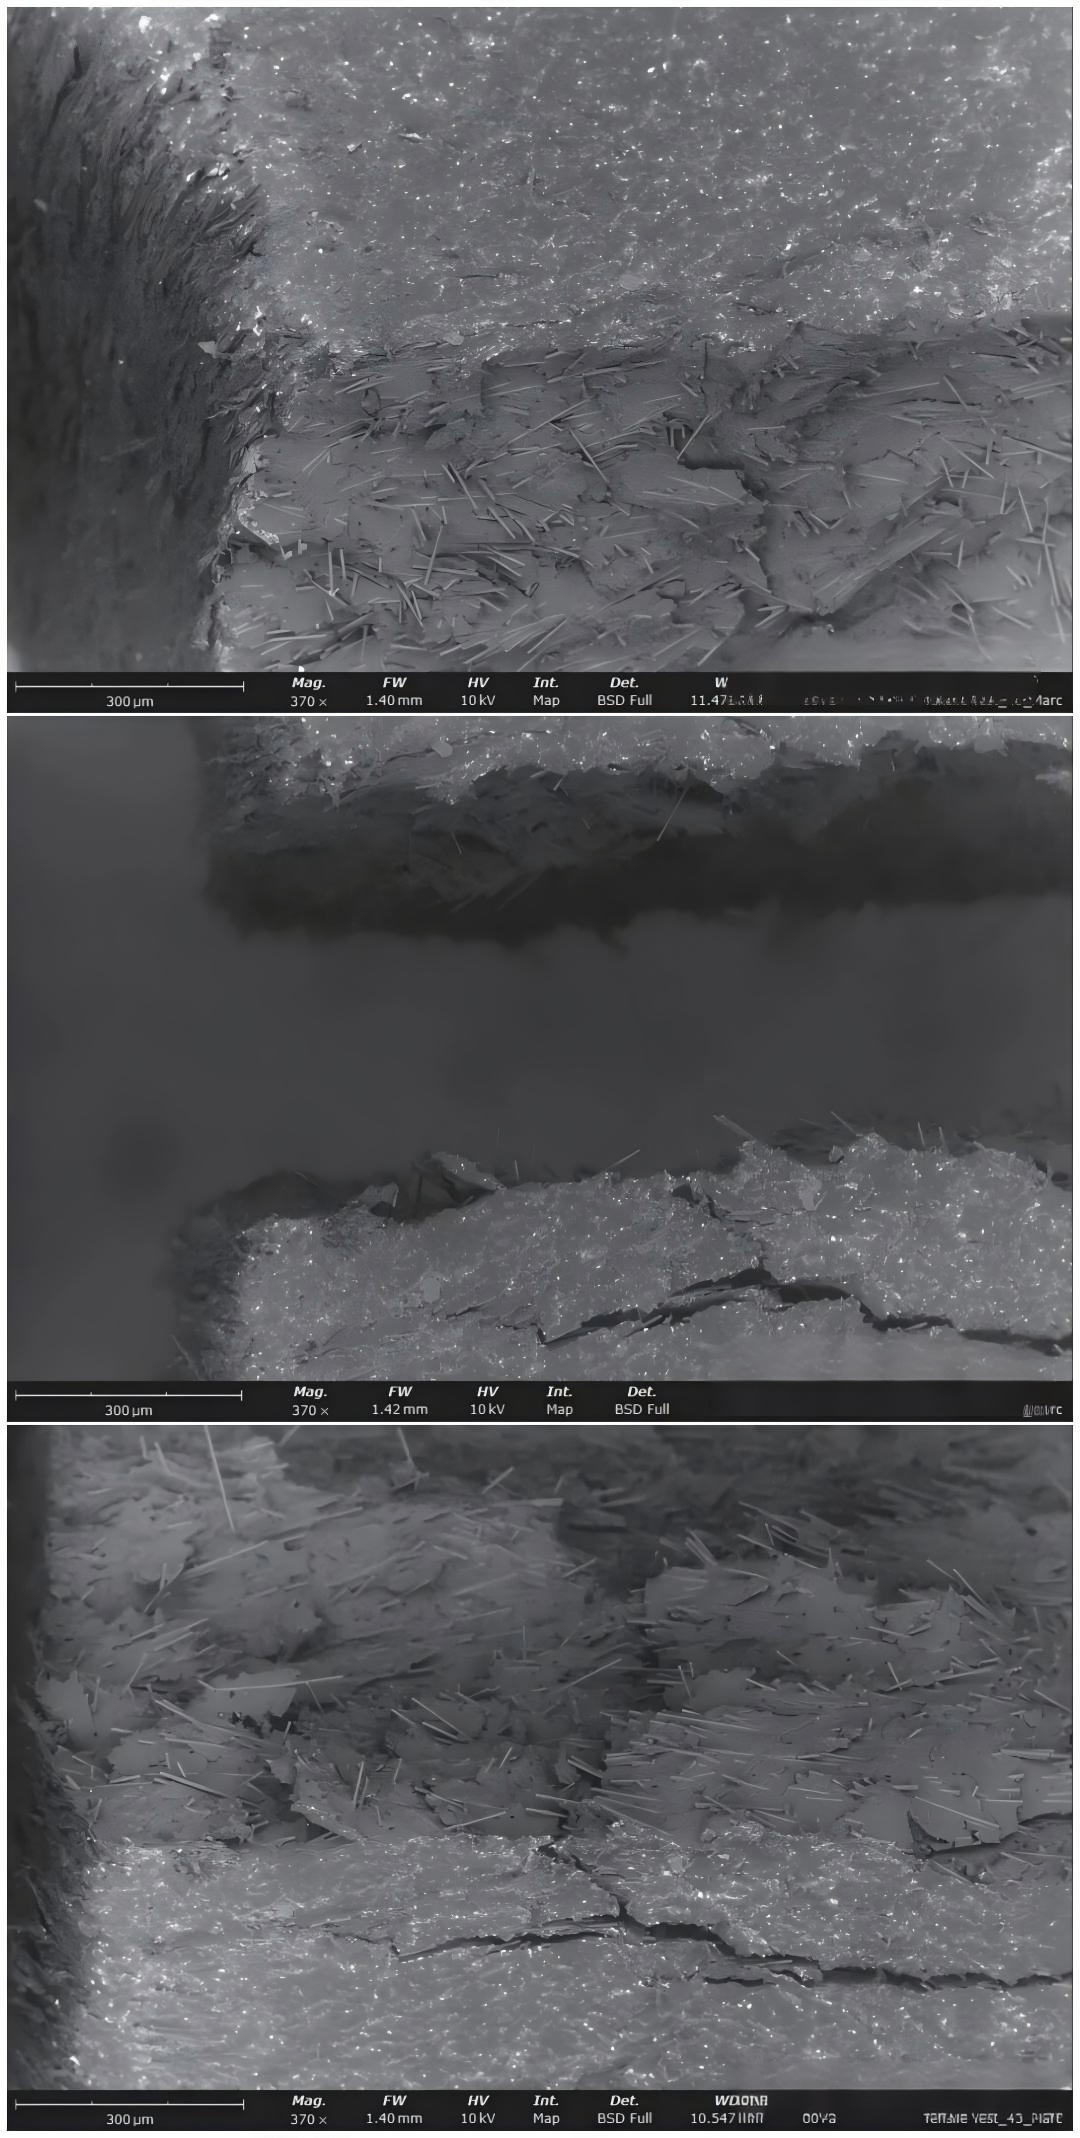
Figure 11: Scanning electron microscopy image of fracture surface
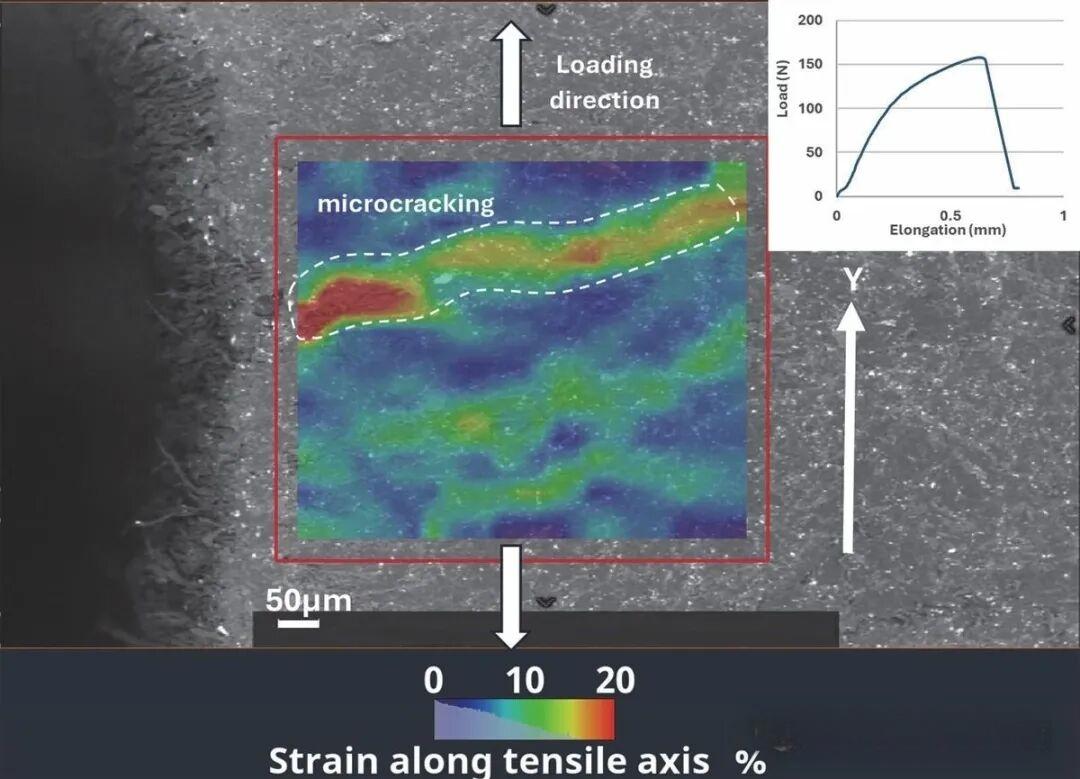
Figure 12: Scanning electron microscope frame superimposed axial strain field Eyy
Digital Image Correlation (DIC) Analysis
Perform 2D DIC analysis on SEM videos using Avizo software to calculate surface displacement and strain fields.
As a result, it was found that:
The axial strain Eyy forms a high strain band inclined at approximately 5 ° in the upper part;
Cracks rapidly propagate in the strain band, ultimately leading to macroscopic fracture;
The experimental strain field is highly consistent with the finite element simulation results, verifying the accuracy of the modeling method.
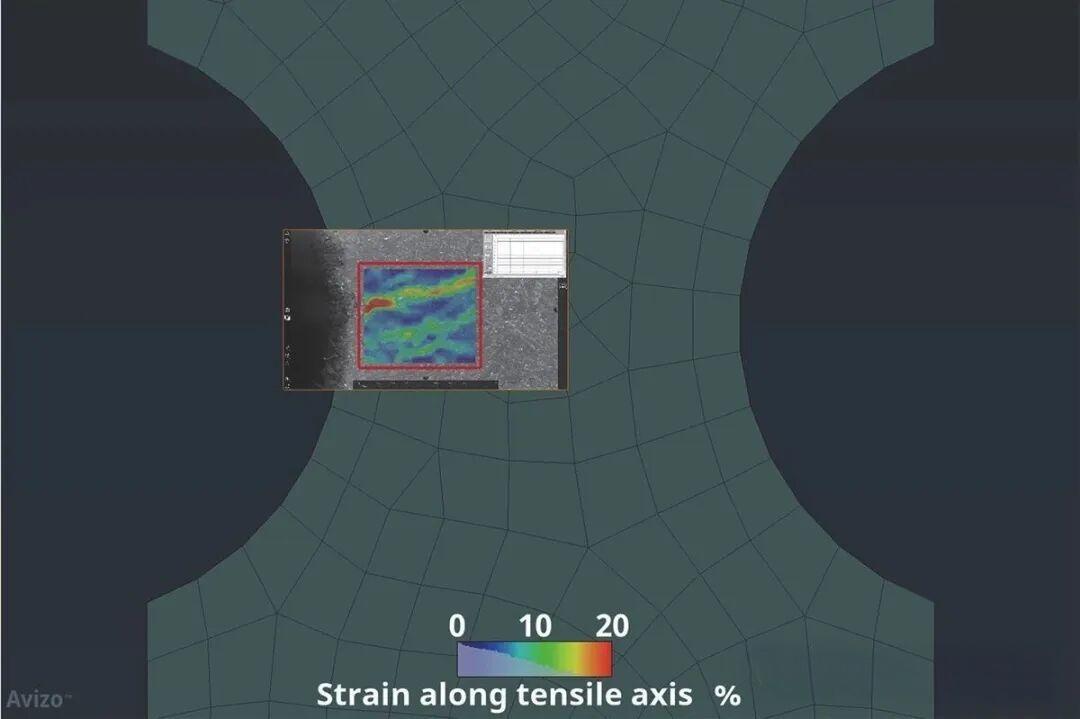
Figure 13: Comparison between finite element mesh and DIC region (red box)
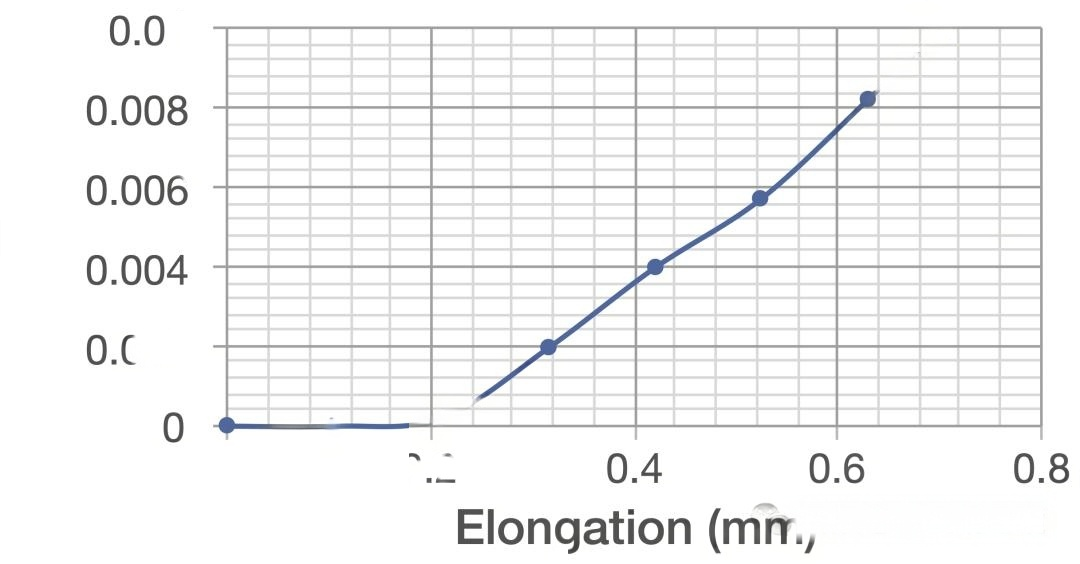
Figure 14: Strain versus displacement curve
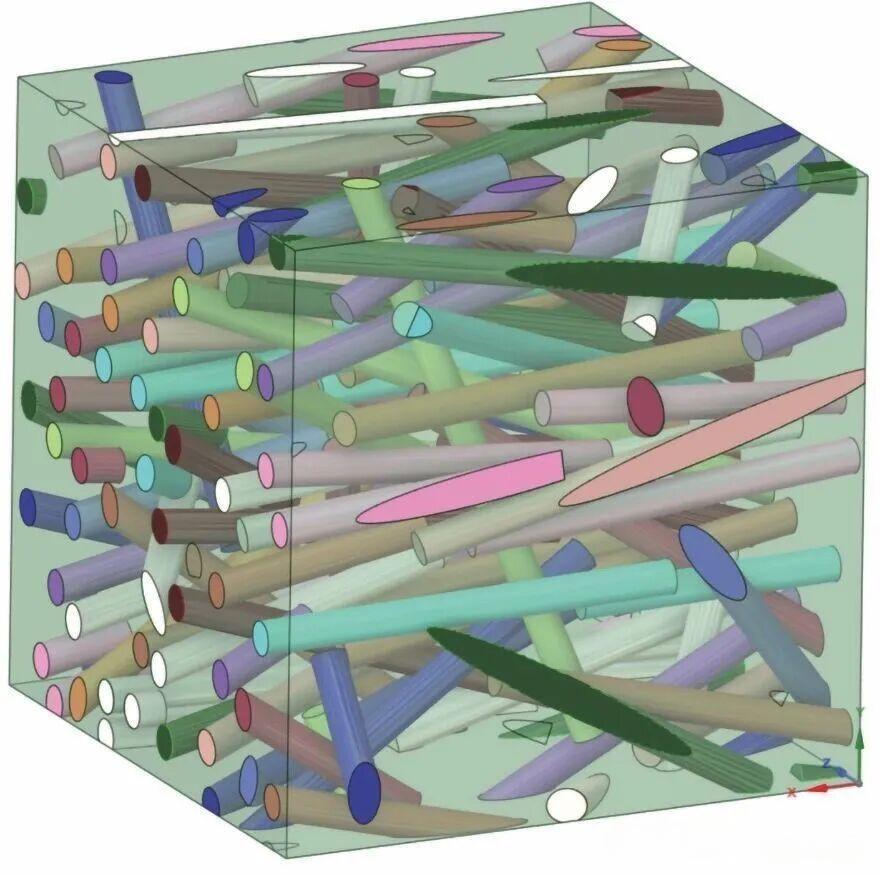
Figure 15: Finite element simulation results of representative volume elements
Numerical modeling and simulation
Using Ansys Workbench platform for modeling:
Fiber orientation tensor input model exported through CT
Create anisotropic elastoplastic material cards in Material Designer
Mapping tensors to the local coordinate system of finite element mesh to achieve material properties changing with fiber orientation
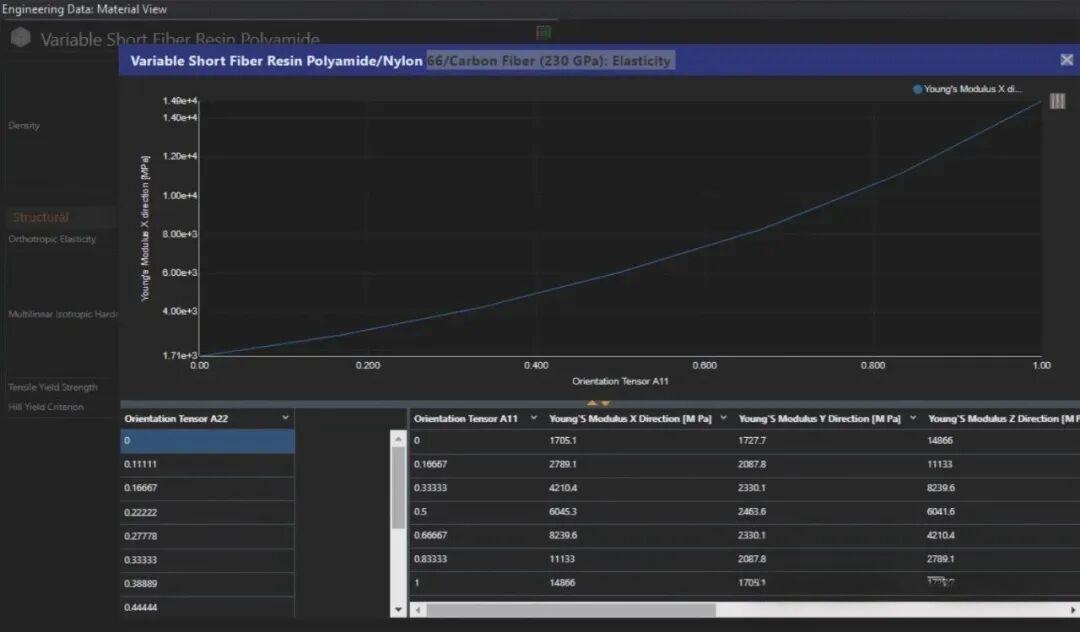
Figure 16: Schematic diagram of material card and orientation tensor interpolation
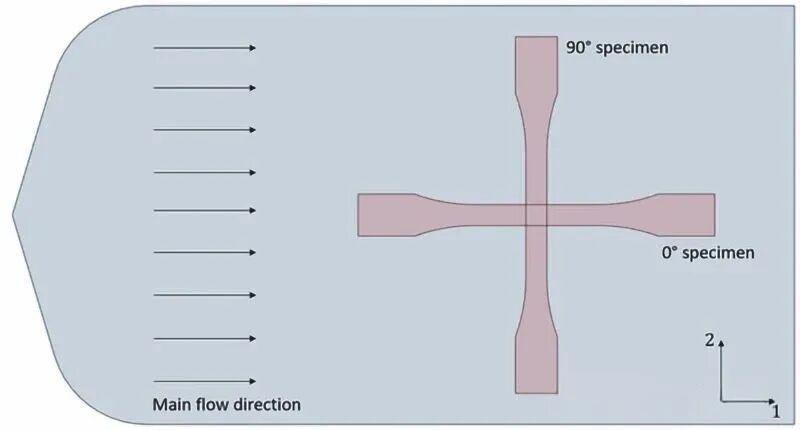
Figure 17: Schematic diagram of standard samples used for material calibration
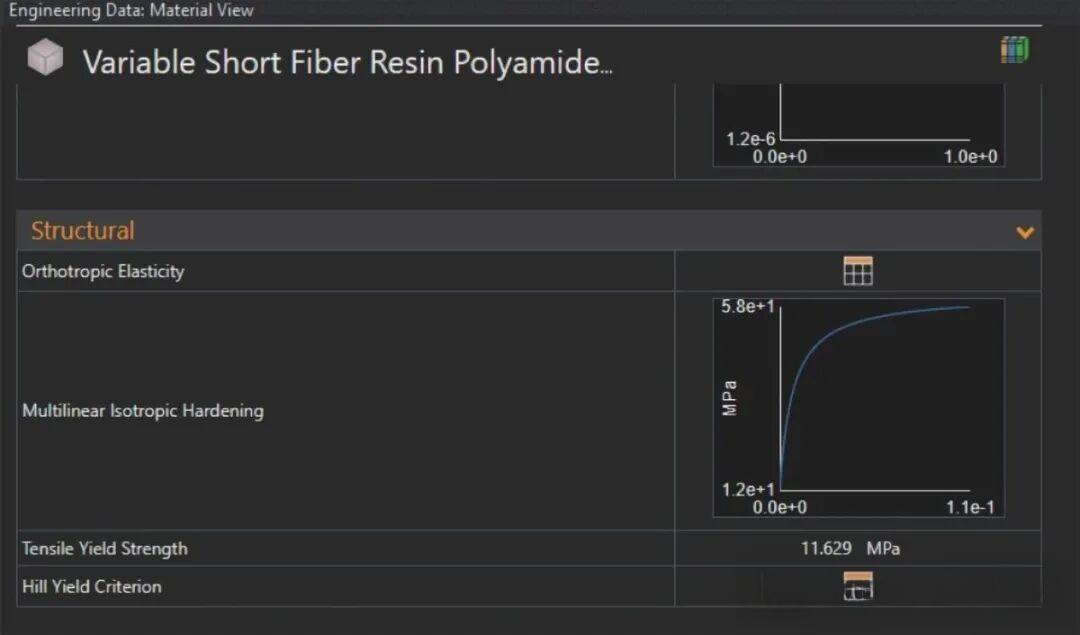
Figure 18: Final material model (anisotropic yielding and hardening)
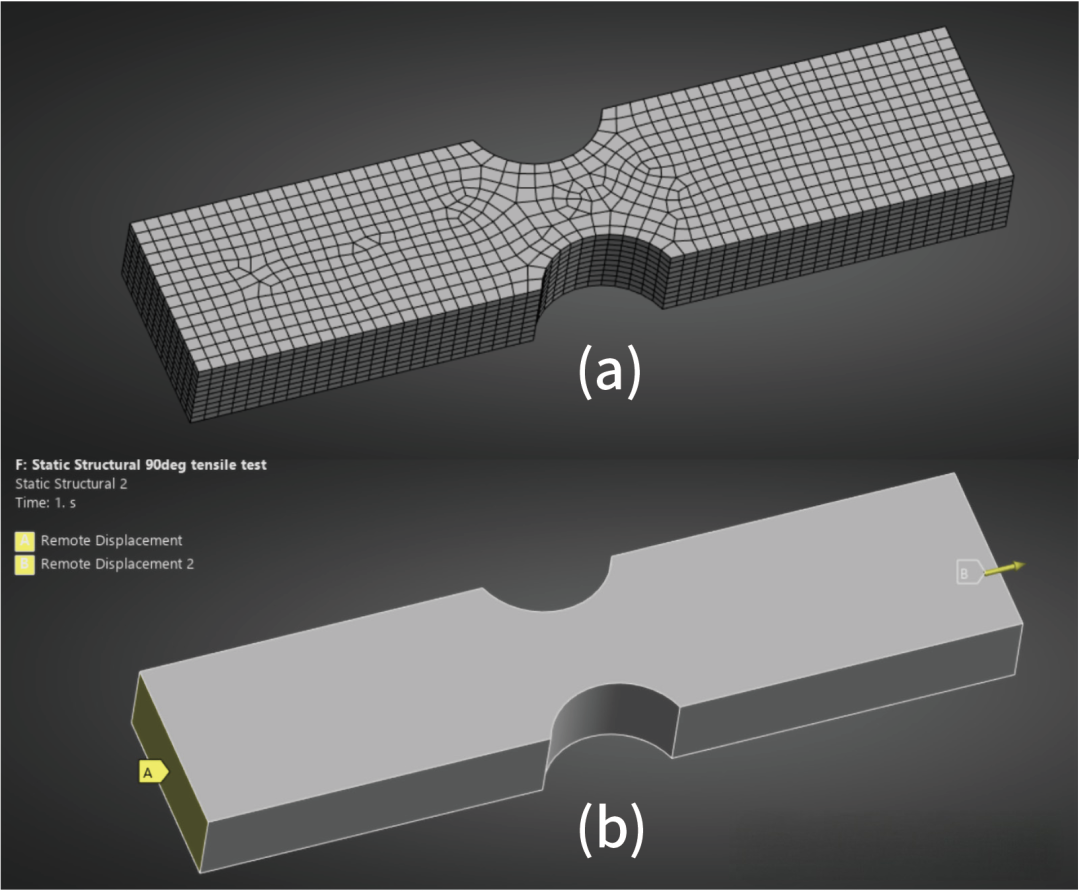
Figure 19: Grid and tension settings for SFRC modeling
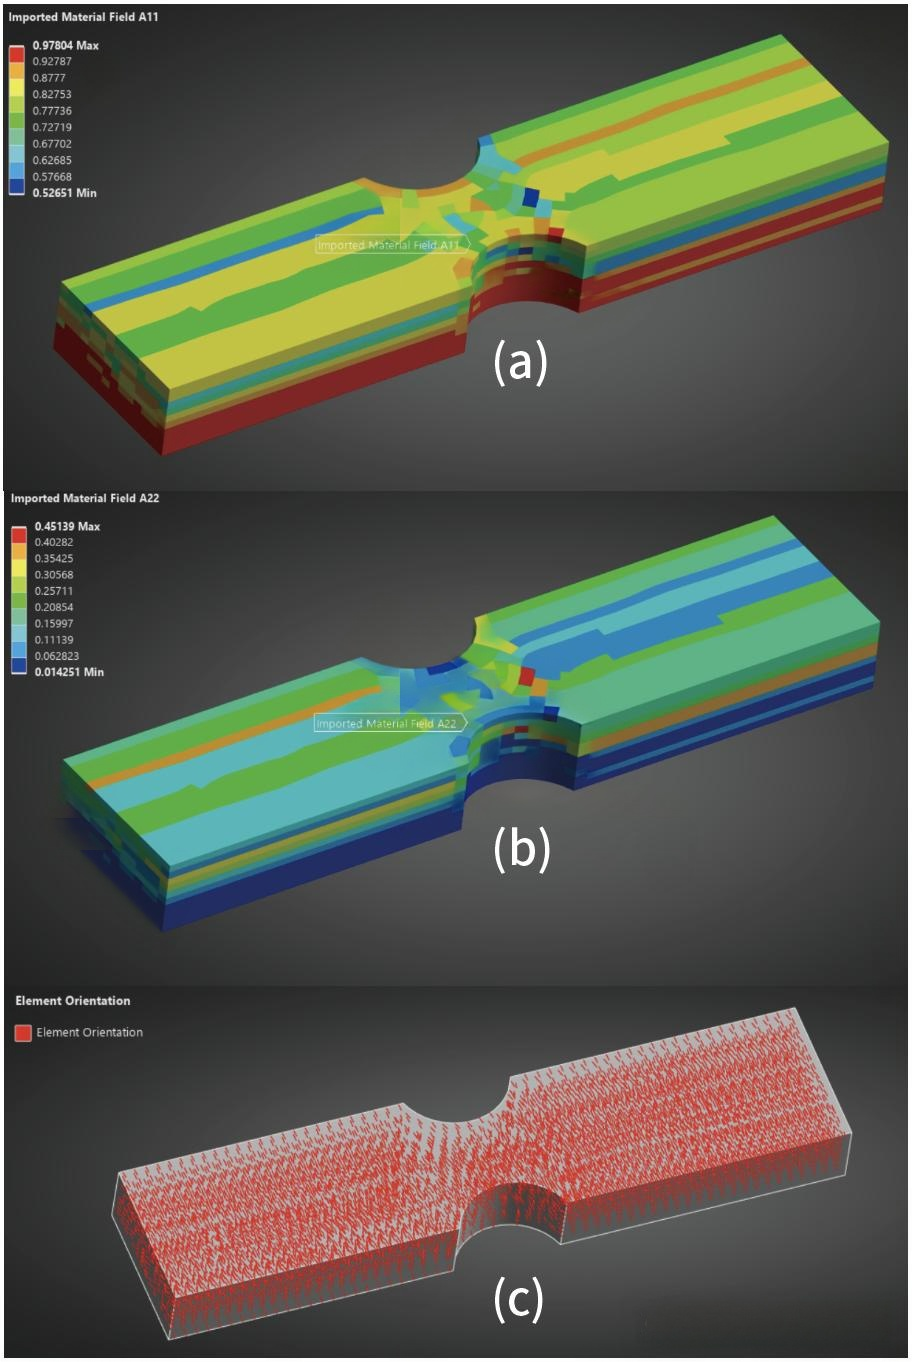
Figure 20: Fiber orientation tensor mapping results
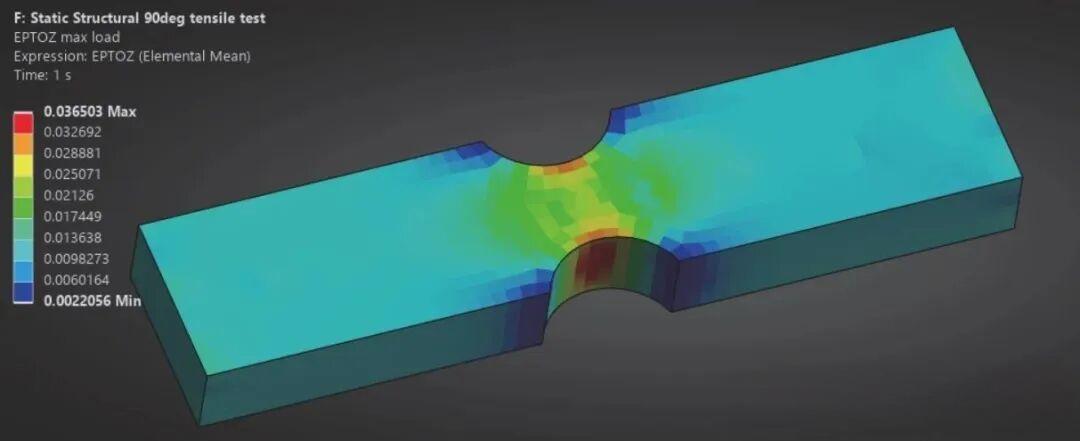
Figure 21: Simulation results of axial strain distribution
Conclusion
This study demonstrates a full chain characterization method from raw material recycling, 3D printing, microscopic imaging to numerical modeling. By integrating micro CT, scanning electron microscopy, DIC, and finite element analysis, accurate description and performance prediction of regenerated carbon fiber composite materials have been achieved.
This method not only promotes the industrial application of sustainable composite materials, but also provides an example for predictive material design and green manufacturing. In the future, manufacturers can confidently design composite components that combine high performance and environmental characteristics through similar comprehensive analysis methods.