-
E-mail
info@phenom-china.com
-
Phone
18516656178
-
Address
Room T5705, Shanghai Hongqiao Libao Plaza, No. 88 Shenbin Road, Hongqiao Town, Minhang District, Shanghai
Funa Scientific Instruments (Shanghai) Co., Ltd
Multidimensional characterization (Part 1) | Using CT, scanning electron microscopy, and simulation to "see through" regenerated carbon fiber composite materials
Date: 2025-11-07Read: 1
Composite materials are materials composed of two or more different components, and unlike traditional materials, their properties and structures can be designed synchronously. Short cut fiber-reinforced composites (SFRC) are widely used in fields such as automotive, construction, and aerospace, with advantages such as low manufacturing cost, high impact strength, light weight, and high stiffness and strength. However, predicting its mechanical properties remains challenging due to the complex influences of fiber orientation, manufacturing processes, and material microstructure.
This study was jointly conducted by Thermo Fisher Scientific, Synopsys, 3Dmagination, Waygate Technologies, and the Institute of Polymer Engineering at Northwestern Polytechnical University in Switzerland. The research team systematically characterized the recycled short carbon fiber-reinforced polyamide 11 (rCF-PA11) composite material through micro computed tomography (microCT) and 3D image analysis, mechanical testing, and numerical modeling, exploring its potential in sustainable manufacturing.
01. Sample preparation
The study used regenerated T700 carbon fiber and biobased polyamide 11 (PA11) as matrix materials, and the preparation process includes:
1. Solvent decomposition and resizing of T700 carbon fiber
2. Mixing and compounding with PA11 (15 wt.%)
3. Extrusion into silk and 3D printing forming
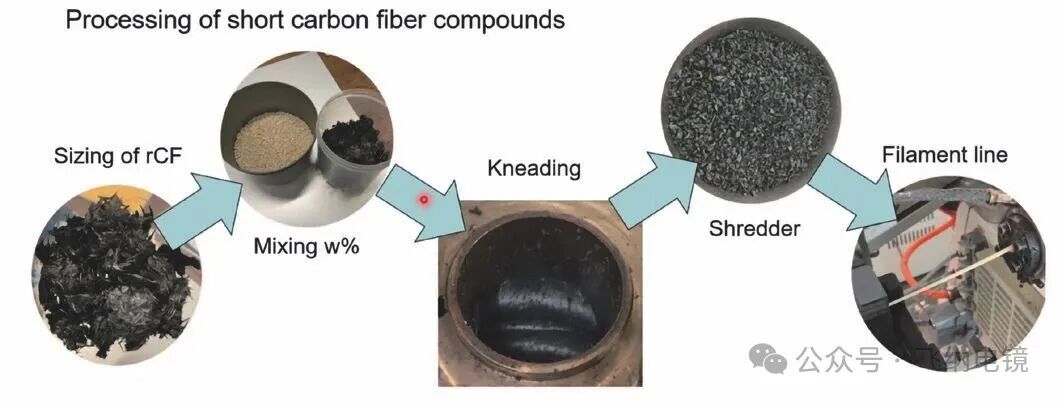
Figure 1: Schematic diagram of the preparation process of regenerated carbon fiber
Printing uses 9T Labs' Additive Fusion Technology (AFT), which combines continuous stack printing with high-pressure fusion to achieve dense structures and high-performance composite parts. By controlling the nozzle temperature, extrusion speed, and layer height, the carbon fiber distribution is ensured to be uniform and not damaged.
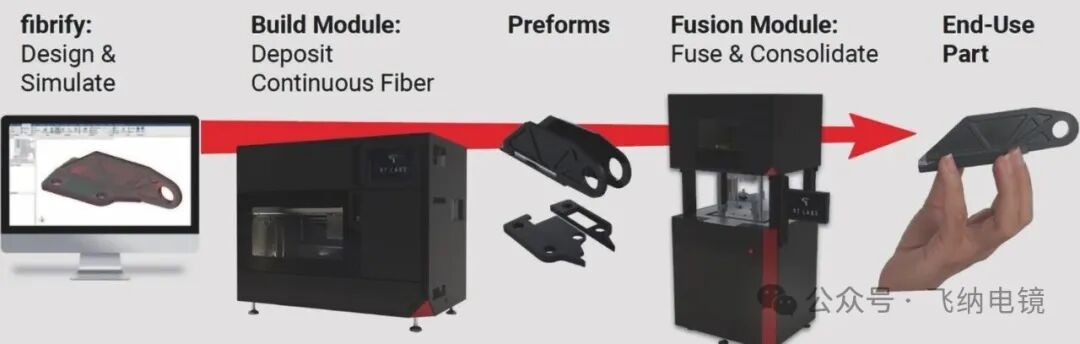
Subsequently, heat and pressure are applied in the closed mold for fusion treatment, eliminating interlayer pores and improving the fiber matrix interface adhesion.
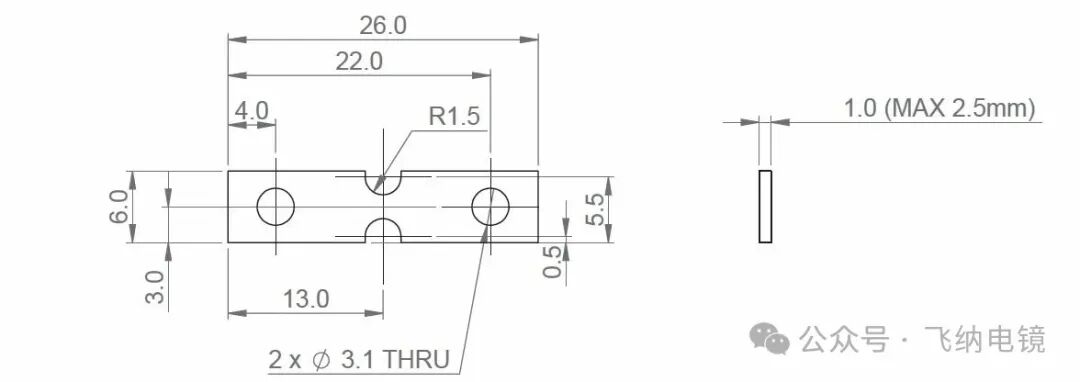
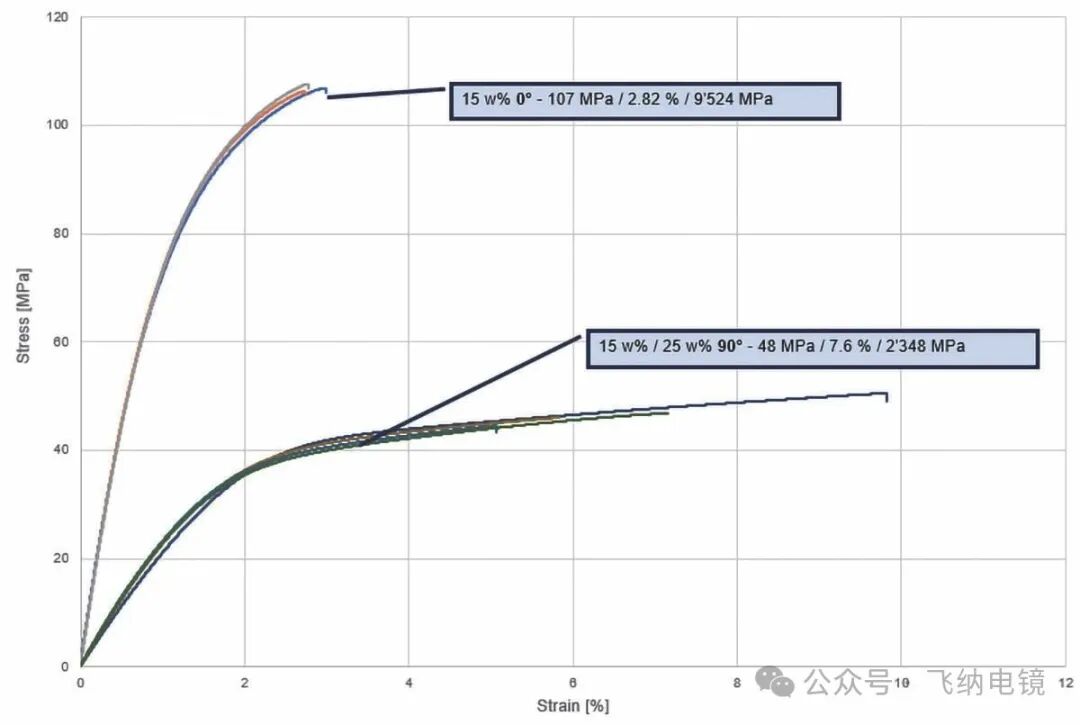
Figure 4: Stress strain curve of short fiber reinforced composite material
02.Mechanical performance testing
Samples with 0 ° and 90 ° orientations were prepared using DIN 527-1 standard and subjected to quasi-static tensile testing at room temperature.
The results show that:
0 ° direction sample: high stiffness, brittle fracture, performance mainly dominated by fibers;
90 ° direction sample: low initial stiffness, significant nonlinearity, exhibiting polymer dominated characteristics;
The minimal differences between samples with the same orientation indicate good reproducibility of the experimental results.
03.High resolution CT scan
Perform two CT scans using the Waygate Technologies Phoenix V | tom | x M300 system:
Full sample scan: Analyzing the overall distribution of fibers (7.3 µ m ³ voxel)
Local high-resolution scanning: focus on the central area of the sample (2 µ m ³ voxel)

Figure 5: CT volume map and local cross-sectional view reconstructed by 3D

Figure 6: Volume rendering results of high-resolution CT scan
04. Image segmentation and fiber tracking
Utilizing Thermo Scientific ™ Avizo ™ The XFiber module of 3D Pro software performs segmentation and fiber centerline tracking on CT reconstruction data. This algorithm extracts a single fiber through template matching and line tracking, and calculates its length, orientation, curvature, and curvature. Finally, over 198000 fiber data were obtained and exported in tensor form to Ansys for finite element modeling.
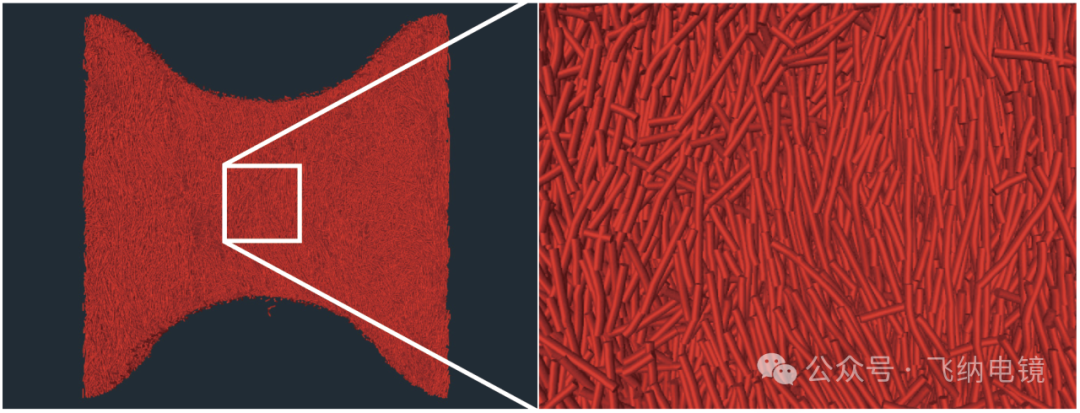
Figure 7: Single fiber segmentation and local magnification
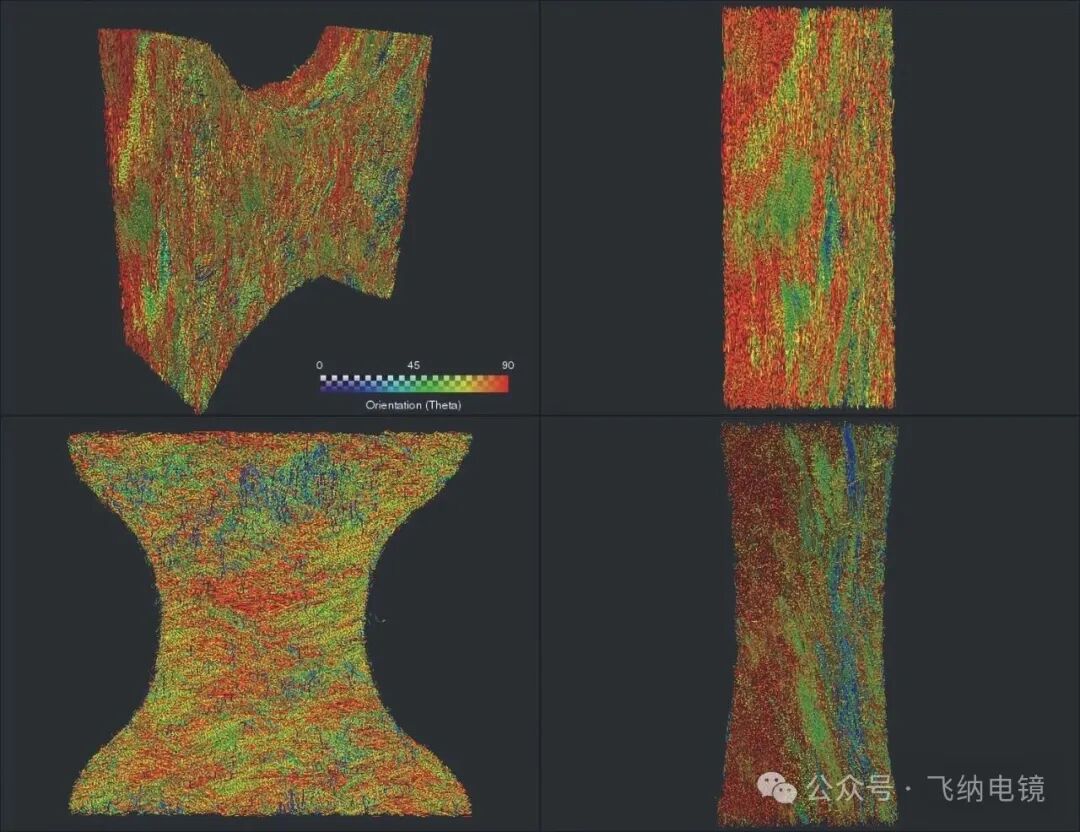
Figure 8: Fiber orientation distribution map within the region

Figure 9: Exporting orientation tensor data for simulation
Through micro CT imaging and precise tracking algorithms, researchers can quantify the orientation distribution and interface characteristics of fibers, laying the foundation for subsequent mechanical modeling and fracture behavior analysis.