-
E-mail
yibao@szyibao.com.cn
-
Phone
18675539088
-
Address
312, Shangshuijing Comprehensive Building, 333 Jihua Road, Jihua Street, Longgang District, Shenzhen City, Guangdong Province
Shenzhen Yibao Technology Co., Ltd
Decoupling prediction of water pollutant content using UV visible spectroscopy
Date: 2025-11-14Read: 2
Chemical oxygen demand (COD) and turbidity (TURB) respectively represent the content of reducing organic matter and suspended solids in water bodies, and are important monitoring indicators for water pollution.
Spectral analysis methods have sensitive response, fast analysis speed, and good repeatability. Among them, ultraviolet spectroscopy has been widely studied and applied due to its mature detection principle, which can indirectly reflect physical and chemical parameters such as organic matter and suspended solids in water. In practical testing, turbidity scattering can cause serious interference to the UV absorption spectrum of COD, thereby affecting the accuracy of spectroscopic detection;
In response to the problem of characteristic coupling and spectral peak overlap interference in the synchronous detection of chemical oxygen demand (COD) and turbidity using ultraviolet spectroscopy, which seriously affects the detection accuracy. The rapid and accurate coupling interference analysis and content detection of multiple pollutants in water bodies are of great significance for real-time monitoring of field water quality.

Detection principle:
The principle of water quality testing is to qualitatively and quantitatively analyze pollutants and water quality parameters in water samples through various physical, chemical, and biological methods, in order to evaluate the purity and safety of water bodies.
Generally speaking, the principle of spectroscopic detection is based on the interaction between matter and light. When light is irradiated onto a substance, the molecules or atoms in the substance absorb light of a specific wavelength, resulting in a characteristic absorption spectrum. Different substances have different spectral characteristics, so it is possible to identify and quantitatively analyze various components in water samples by analyzing spectra.
Lambert Beer's law states that when a parallel beam of light passes through a uniform absorbing substance, the absorbance A of the solution is proportional to the product of the concentration c of the absorbing substance in the solution and the optical path length l. namely:
A=ε⋅c⋅l
among which
A is the absorbance,
ε is the Molar Absorption coefficient, measured in L · mol−1·cm−1,
C is the concentration of the absorbing substance, measured in mol · L−1,
L is the optical path length, measured in centimeters.
When the optical path is constant, the absorption of light of a specific wavelength depends on the concentration of the corresponding component to be measured.
In addition to absorption spectroscopy, there are also some applications that use the excitation or scattering characteristics of substances to identify and quantitatively analyze chemical substances in water, such as fluorescence spectroscopy: based on the characteristic of certain substances emitting fluorescence under specific wavelength light excitation, the content of substances is analyzed by detecting the fluorescence intensity and wavelength.
Experimental approach:
Common water quality indicators:
Chemical Oxygen Demand (COD): represents the content of reducing organic matter in water;
Biochemical Oxygen Demand (BOD): Reflects the microbial content in water;
DOM: dissolved organic matter content in water;
TOC: Total Organic Carbon Content;
DOC: dissolved organic carbon content;
SAC: Specific absorption coefficient;
SSK: Water soluble potassium;
Turbidity: suspended solids content in water;
Ammonia nitrogen, total phosphorus, and total nitrogen content;
The absorption spectral ranges corresponding to different water quality parameters and components in water bodies are different. For example, the absorption spectral ranges of nitrate and nitrite are between 200-250nm, low molecular compounds, aromatic compounds, proteins, organic solvents, etc. are between 250-290nm, and turbidity and total dissolved solids are between 380nm. Therefore, a UV visible spectrometer with a detectable wavelength range of 200-800nm is used for absorbance detection instead of single wavelength absorbance detection, which can clearly reflect the distribution of various substances in water bodies.

Measurement principle: UV visible absorption method (spectrophotometry); Fluorescence spectroscopy method;
Spectrometer model: ATP2000 series (high signal-to-noise ratio, high pixel, high integration)Degree)
Traditional detectors use photomultiplier tubes combined with a single wavelength scanning mechanism, which is bulky, time-consuming, and cannot adapt to transient process analysis. Relatively speaking, miniature fiber optic spectrometers are capable of transient acquisition of the full spectrum, enabling continuous and real-time online monitoring of water quality, making them more suitable for field and online measurements.

The method of measuring absorbance with a spectrometer is to pass parallel light within a certain wavelength range through a colorimetric dish containing a sample, and detect the transmitted light beam. By comparing the spectra of the sample before and after absorption, the absorption spectrum of the sample for that wavelength range can be obtained.

By measuring the absorption in the entire UV/visible range and establishing a stoichiometric model, it is possible to simultaneously detect the content of multiple parameters in water quality.
Spectral acquisition:
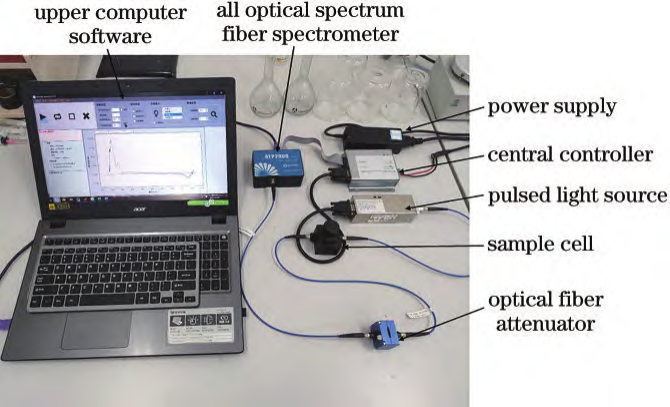
The spectral acquisition system used in the experiment consists of an ATP2000P spectrometer, ATG1020 pulsed xenon lamp, central controller, colorimetric dish, fiber optic attenuator, and display.
The wavelength range of the spectrometer test is 180-1000 nm, with a resolution of 2.3 nm and a signal-to-noise ratio>500:1.
Using a 10mm quartz cuvette as the sample cell, the output optical power of the pulse light source is adjusted through a fiber attenuator to ensure the stability of the absorption spectrum and avoid light saturation distortion and fluctuation noise.
Experimental sample:COD standard solution: provided by the National Nonferrous Metals and Electronic Materials Analysis and Testing Center, with potassium hydrogen phthalate as the solute and a mass concentration of 500 mg/L;
Fumalazine turbidity standard solution: provided by Hangzhou Qiwei Instrument Co., Ltd., 400 NTU;
Spectral data collection:
Collect absorption spectra of COD and turbidity standard solutions with different mass concentration gradients.
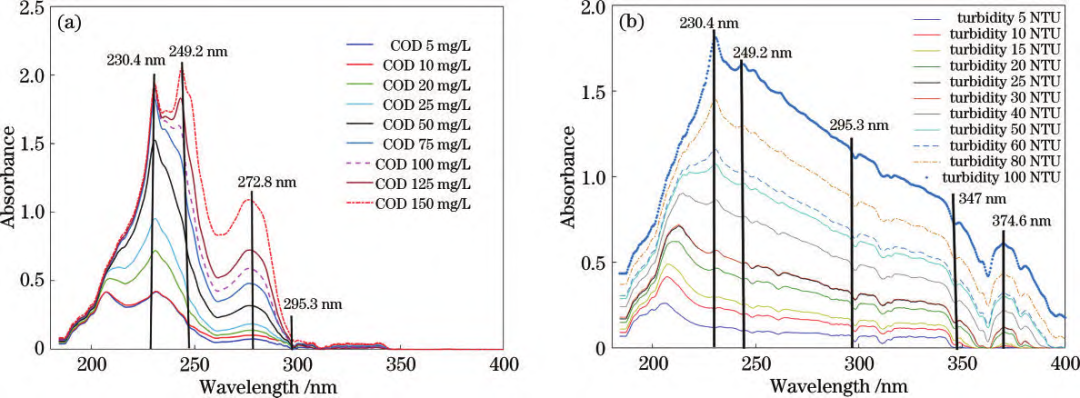
The effective spectral range is 180-400 nm, the integration time is 9 ms, the sampling interval is 500 ms, and the average scanning frequency is 20 times. After collecting spectral data 5 times for each sample, the average value is taken, and the spectral graph is shown below.

UV absorption spectrum of standard solution, (a)COD; (b) Turbidity;

By comparing the spectral lines of various standard solution samples, it can be seen that the main absorption characteristics of COD and turbidity are concentrated in the range of 180-400 nm.
1. The characteristic peak range of COD is between 180~300 nm. As the mass concentration increases, the UV spectral absorbance gradually increases, and the two characteristic absorption peaks significantly rise;
2. The absorption characteristic peak range of turbidity spectrum is between 180-400nm, and the overall absorbance increases with the increase of turbidity.
3. In the mixed sample, the enhanced turbidity interference causes the COD absorption spectral line to rise upward, and the main absorption peak to shift to the right. The enhanced COD interference causes the turbidity absorption peak to rise significantly upward, and is less affected by interference in the 300-400 nm range.
Spectral data preprocessing:
Due to the significant impact of external environment, measurement conditions, and the characteristics of the instrument itself on the measurement results during spectroscopic measurement. The collected raw data usually contains a large amount of redundant and collinear data, which significantly affects the accuracy of later models and data processing efficiency. To mitigate or eliminate this effect, it is usually necessary to preprocess the collected spectral data, such asFeature wavelength selectionAnd correspondingalgorithm optimizationThus, effective spectral data can be obtained to improve the accuracy and stability of model detection.