-
E-mail
ustc_sc@163.com
-
Phone
18020740586
-
Address
Room 1503, Building A04, Software Park Phase III, Jimei District, Xiamen City, Fujian Province
Opu Tiancheng (Xiamen) Optoelectronics Co., Ltd
AOPU Tiancheng ATH9010 helps agricultural production
Date: 2025-12-01Read: 2
Wheat is one of the three major grain crops in China (wheat, rice, and corn) and is a key factor in the country's food security strategy. However, crop pests and diseases (with over 20 common diseases) seriously endanger the safety of wheat production. Explosive outbreaks and regional epidemics of stripe rust caused by wheat stripe rust fungus. In popular years, stripe rust can reduce wheat yields by more than 40%, and even lead to complete crop failure. Therefore, preventing and controlling wheat stripe rust is crucial for food security. Only by accurately monitoring wheat diseases can we effectively prevent and control them, and minimize losses to the greatest extent possible.
Traditionally, crop diseases have been monitored visually, which has significant limitations such as limited coverage and strong subjectivity of investigators. Therefore, an efficient and non-destructive crop disease monitoring method is needed to replace traditional methods. After years of development, remote sensing has become an effective technology for monitoring crop diseases. The advantage of remote sensing is that it can assess the spatial distribution of crop diseases at low cost, thereby better controlling diseases.
Hyperspectral remote sensing is a relatively advanced technology. Compared with multispectral technology, it can provide rich narrowband information. Previous studies have discussed the advantages of hyperspectral remote sensing over multispectral sensing in various applications. The advantage of hyperspectral technology in crop disease monitoring is that it can capture certain physiological changes caused by diseases, such as pigment and moisture content. In previous studies, many crop diseases have been monitored through hyperspectral remote sensing, including wheat yellow rust, powdery mildew, Fusarium head blight, peanut leaf spot disease, tomato leaf spot wilt virus, and rice bacterial leaf blight.
The vegetation index (VI) has shown good performance in monitoring crop diseases in previous studies. VI is sensitive to physiological changes inside leaves caused by diseases, but cannot represent changes in leaf surface characteristics. Texture is a feature that reflects external changes caused by diseases and has been proven to have good performance in crop disease monitoring. Previous studies have combined spectral and texture features to enhance the ability to characterize diseases. These studies confirm the effectiveness of VI, texture features (TF), and their combinations in crop disease monitoring. However, previous studies on the fusion of spectral and image features for detecting crop diseases have mostly been conducted at the leaf scale, and the feasibility of this method for detecting diseases at the field scale has not been confirmed.
Unmanned aerial vehicle remote sensing technology combines the advantages of high flexibility, low cost, and easy operation, making up for the shortcomings of traditional satellite remote sensing. By mounting remote sensing equipment on drones, high spatiotemporal resolution spatial remote sensing information can be quickly collected, followed by data processing, modeling, and application analysis. This provides important technical support for the development of intelligent management of farmland.
To further investigate this issue, unmanned aerial vehicles equipped with hyperspectral sensors were used to monitor multiple infection stages of wheat yellow rust at different spatial scales. The research objectives are: (1) to evaluate the performance of VI, TF, and their combinations obtained using unmanned aerial vehicle hyperspectral images for monitoring wheat yellow rust at the field scale; (2) Determine the optimal image spatial resolution for monitoring wheat yellow rust using drone imagery; (3) Establish a field scale monitoring model for yellow rust disease in the early, middle, and late stages of infection using optimal features and spatial resolution.

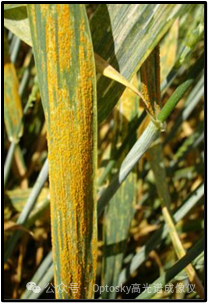
Figure 1 Normal wheat leaves (left) and yellow rust wheat leaves (right)
2Technical ideas and main content
2.1. Remote sensing image acquisition and preprocessing
Using a drone system equipped with hyperspectral imaging sensors (Figure 2) to capture wheat images. The unmanned aerial vehicle hyperspectral imaging system consists of four parts, including a six rotor electric unmanned aerial vehicle system, a hyperspectral data acquisition system, a three-axis stabilization platform, and a data processing system.
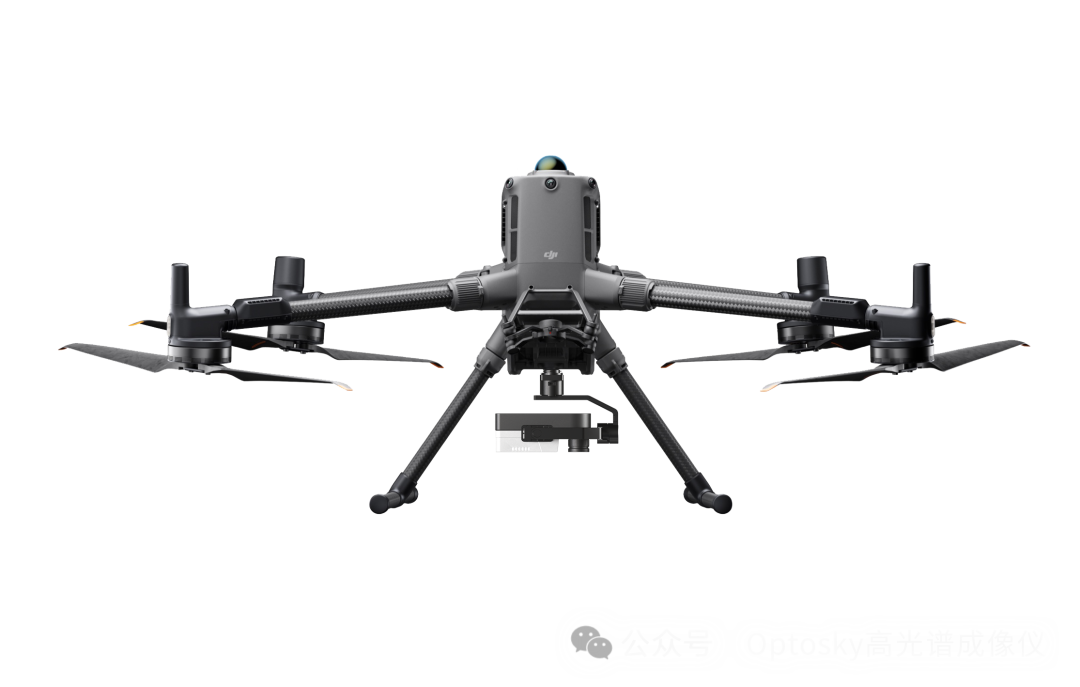
Figure 2 Drone Sensor
The drone flies at an altitude of 30 meters, with a speed of 4 m/s. The forward overlap is about 80%, and the lateral overlap is about 60%. At a flight altitude of 30 meters, we obtained hyperspectral images with a spatial resolution of 1.2 cm and a spectral resolution of 4 nm. The collection of hyperspectral data by drones requires clear weather, no wind or low wind speed. The image acquisition period in this study is from 11:00 am to 1:00 pm.
During the critical period of wheat growth, we conducted six drone based hyperspectral observation experiments on April 25th, May 4th, May 11th, May 18th, May 24th, and May 30th, corresponding to days 7, 16, 23, 30, 36, and 42 (DPI) after inoculation. Figure 3 shows the development of wheat yellow rust at different infection stages.

Figure 3: Photos of Wheat at Different Stages
A total of 24 samples were obtained each time, including 8 samples from healthy plots and 16 samples from two inoculated plots. A total of 144 samples were obtained from 6 experiments, including 57 healthy samples and 87 samples infected with yellow rust disease.
The severity of wheat yellow rust is described by the Disease Index (DI). Randomly select 40 wheat plants from each 1m2 plot, and evaluate the severity of the disease using the first and second wheat leaves at the top of the selected plants. A total of 80 leaves are selected for each plot to calculate DI. According to the National Code for Investigation and Forecast of Crop Diseases (GB/T 15795-2011), the incidence rate of leaves is divided into nine levels (0%, 1%, 10%, 20%, 30%, 45%, 60%, 80%, 100%), of which 0% is healthy, 1% is disease level 1, 10% is disease level 2... 100% is disease level 8. The assessment of yellow rust incidence rate was conducted immediately after the UAV acquired the images, and was conducted by the same person under the guidance and supervision of professionals.
2.2. Experimental Method
Establish a monitoring model for wheat yellow rust disease using PLSR. PLSR has previously been applied to crop growth monitoring and physiological and chemical parameter estimation. PLSR is a classic modeling method that includes the characteristics of three methods: PCA, canonical correlation analysis, and multiple linear regression analysis. In PLSR, the latent structure of variables is determined through component projection, which projects the predicted and observed variables into a new space. Therefore, by selecting the optimal latent variables, the original variables with high data redundancy are transformed into a few variables. PLSR can be represented as a linear model that describes the relationship between predictor variables and observed variables.
2.3. Hyperspectral pixel acquisition
The nearest neighbor algorithm resamples the original image (with a resolution of 1.2 centimeters) to generate new images (with resolutions of 3, 5, 7, 10, 15, and 20 centimeters). The ground objects in the drone images include wheat plants and soil.
2.4. sampling point
This study used the NDVI threshold method to extract wheat pixels from images with a spatial resolution of 1.2 cm. The process of this method is as follows: Firstly, set the optimal NDVI threshold. The NDVI range for general vegetation is 0.3-1.0. After multiple attempts, we found that a NDVI threshold of 0.42 can accurately separate wheat pixels from background pixels. Secondly, NDVI greater than 0.42 will be used to create a mask file for extracting wheat pixels. Finally, we use the mask file to crop the original image, resulting in an image that only contains wheat pixels. In order to ensure the consistency of wheat pixels in images with different spatial resolutions, a mask file was created using the NDVI threshold of the original image (1.2 cm) to extract wheat pixels from images with other spatial resolutions. The reason for selecting these specific resolutions for subsequent processing and analysis of hyperspectral images containing only wheat plant pixels is that they represent the majority of drone images used for monitoring crop health. Figure 4 shows an example of a hyperspectral image of a drone with different spatial resolutions, which is a part of region A in the image obtained on April 25th.
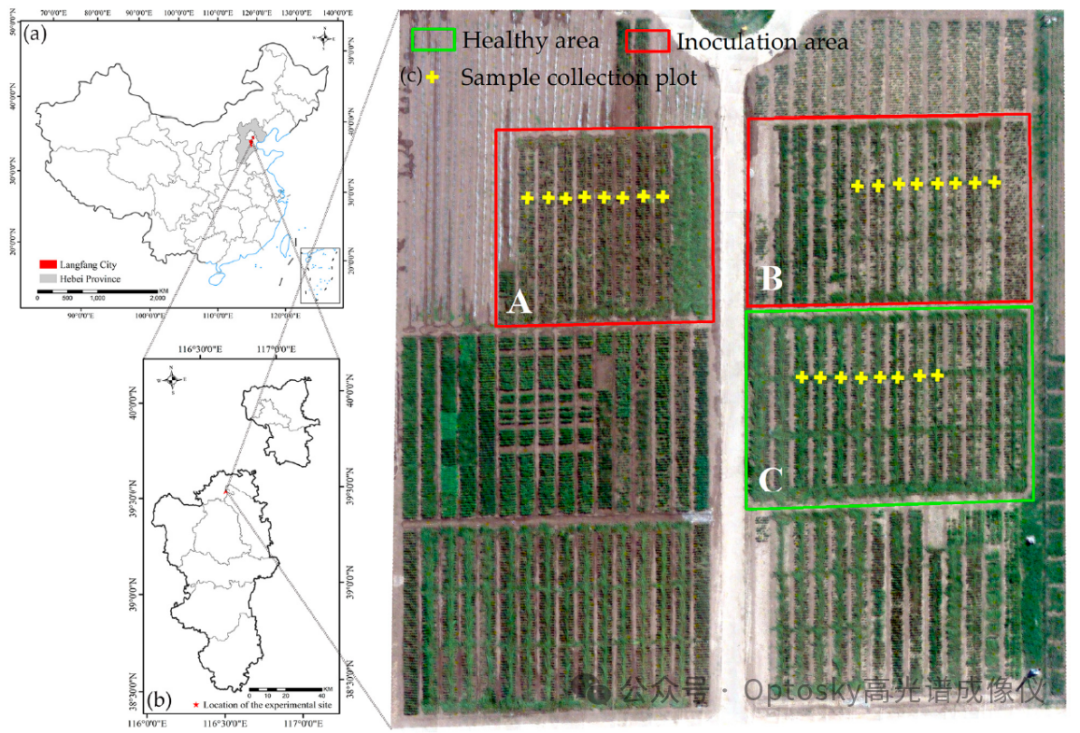
Figure 4: Hyperspectral images of unmanned aerial vehicles with different spatial resolutions
3Conclusion
This application utilizes unmanned aerial vehicle hyperspectral images to monitor wheat stripe rust at the field scale. Different features (VI, TF, and their combinations) are used to establish PLSR monitoring models for early, middle, and late stages of wheat stripe rust, and the impact of different image spatial resolutions (1.2 cm, 3 cm, 5 cm, 7 cm, 10 cm, 15 cm, and 20 cm) on monitoring accuracy is evaluated. The following conclusions were drawn: (1) The VI based model had the highest monitoring accuracy in the middle stage of infection, while the TF based model had the highest monitoring accuracy in the late stage of infection. However, the TF based model is not suitable for monitoring stripe rust in the early stages of infection, with a maximum monitoring accuracy of only 0.28 R2. (2) During the three infection periods, the monitoring accuracy of the VI-TF based model was higher than that of the VI and TF based models, and the highest monitoring accuracy was achieved in the later stages of infection (R2=0.88). In addition, the monitoring accuracy of the VI-TF based model was significantly improved in the early stages of infection, making it suitable for early detection of diseases. (3) The spatial resolution has a relatively small impact on the monitoring accuracy of VI based models, but a significant impact on TF based models. The optimal spatial resolution for VI-TF based models to monitor stripe rust is 10cm.

Figure 5 Recognition results