-
E-mail
info-china@noldus.com
-
Phone
18501168738
-
Address
507, Building 6, No.33 Guangshun North Street, Chaoyang District, Beijing
Nordas (Beijing) Information Technology Co., Ltd
Constructing an "emotional map" for theme parks using facial expressions
Date: 2025-12-19Read: 0
Tourism is not only about physical movement, but also about emotional flow. In theme parks, screams, laughter, astonishment, or exhaustion together form the core of visitors' experiences. However, tourists of different ages and genders may have vastly different emotional reactions when facing the same amusement project or themed area.
A research team from Anhui Normal University and Nanjing Normal University innovatively used geotagged photos on social media, combined with facial expression recognition technology, to draw emotional visualization distribution maps of different tourist groups in Shanghai Disneyland Resort and conduct in-depth research. This provides a more refined perspective for us to understand the tourist experience, and also brings new insights for the refined management and personalized service design of theme parks (Song et al., 2024).
Pay attention to the emotional differences among tourist groups
The tourism industry, as a field full of emotional experiences, has a profound impact on tourists' travel experience, satisfaction, and behavioral intentions based on their emotional state. Emotions not only affect tourists' destination choices, activity engagement, and overall satisfaction, but also directly affect the design of tourism products and the management of tourism destinations. Therefore, a deep understanding of tourists' emotional states is crucial for improving the quality of tourism experience and promoting the sustainable development of the tourism industry.
Traditionally, the measurement of tourist emotions mainly relies on self-report methods such as questionnaire surveys and interviews. Although these methods have achieved certain results in capturing tourists' emotional states, they have problems such as high time consumption, limited data volume, and being affected by tourists' memory bias. Especially when completing questionnaires or interviews after a travel experience, tourists may provide inaccurate information due to memory distortion, which can affect the accuracy of emotional measurement.
Opportunities brought by emerging data and technologies
With the development of mobile communication technology, social media platforms such as Twitter, Facebook, and Sina Weibo have become important channels for tourists to share their travel experiences and emotions. The large amount of user generated content (UGC) on these platforms provides rich data resources for emotion research.
Meanwhile, facial expressions, as a direct reflection of human emotions, not only contain rich emotional information, but also accurately reflect an individual's age and gender characteristics. With the development of facial expression recognition technology, it has become possible to quantify tourist emotions using geotagged facial expressions on social media platforms. This method not only provides more accurate emotional measurement results, but also reveals the emotional differences among different demographic groups in specific tourism scenarios.
Using FaceReader to draw an emotional map
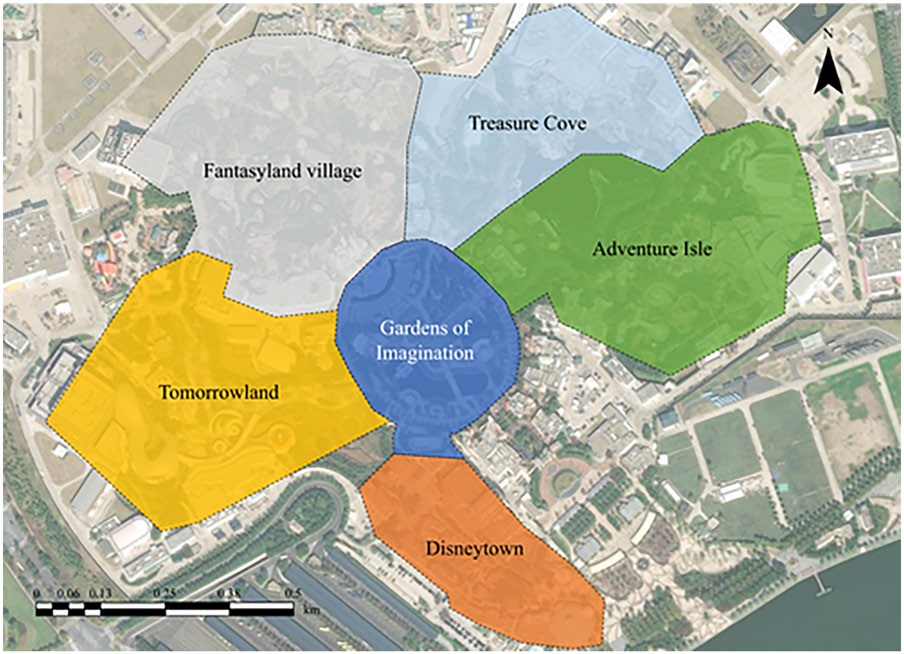
This study takes Shanghai Disneyland in China as the case study site (Figure 1), and collects geotagged Weibo data published between January 2019 and December 2020 through Weibo application programming interfaces (APIs). A total of 227239 geotagged Weibo posts were collected, and after preprocessing (such as removing noisy data), 42988 valid Weibo posts were retained, from which 148132 geotagged facial expression images were identified.
Adopting Nordas'Facial expression analysis system (FaceReader)Perform emotion recognition and demographic attribute classification on the collected facial expression images. The system can not only classify facial expressions into seven basic emotions (happiness, sadness, disgust, anger, surprise, fear, and neutrality), but also quantify the valence and arousal of each emotion. Meanwhile, based on facial features, the gender and age of tourists were identified and divided into six groups: elderly males (OM), elderly females (OF), adult males (AM), adult females (AF), adolescent males (TM), and adolescent females (TF).
Subsequently, based on the circular model of emotions, emotion distribution maps were drawn for each group to visualize the emotional states of different gender and age groups at different attractions in the theme park. The emotional distribution map adopts a two-dimensional coordinate system, with the horizontal axis representing the arousal intensity index (AIS) of the attraction and the vertical axis representing the valence intensity index (VIS) of the attraction. The emotional state of each group is represented by dots of different colors, and the position of the dots is determined by the average valence and arousal value of the group at a specific attraction (Figure 2).
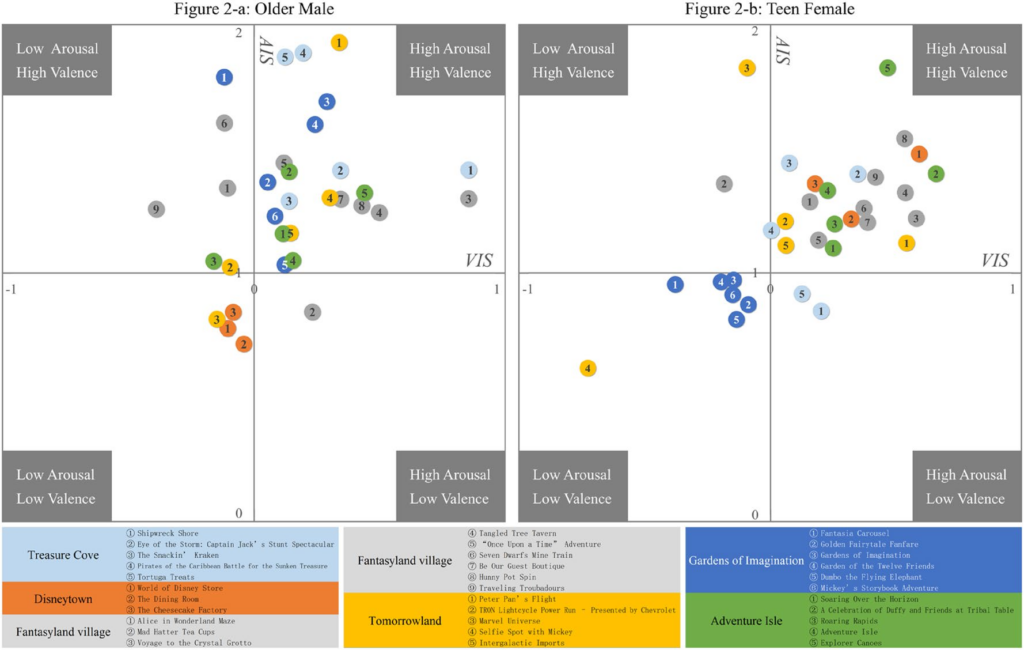
Each evaluation point corresponds to a scenic area. The numerical symbols of the evaluation points in the figure represent the sequence numbers of the scenic spots. The color of the dots represents the theme park of the corresponding scenic area. For example, there are 9 numbers within the gray dots in Figure 2a, indicating that there are a total of 9 scenic spots in the Mirage Village theme park. There are four quadrants in the picture. Quadrant one represents positive emotions and high arousal levels. On the contrary, the third quadrant represents negative emotions and low arousal levels.
Different emotional experiences of different tourists
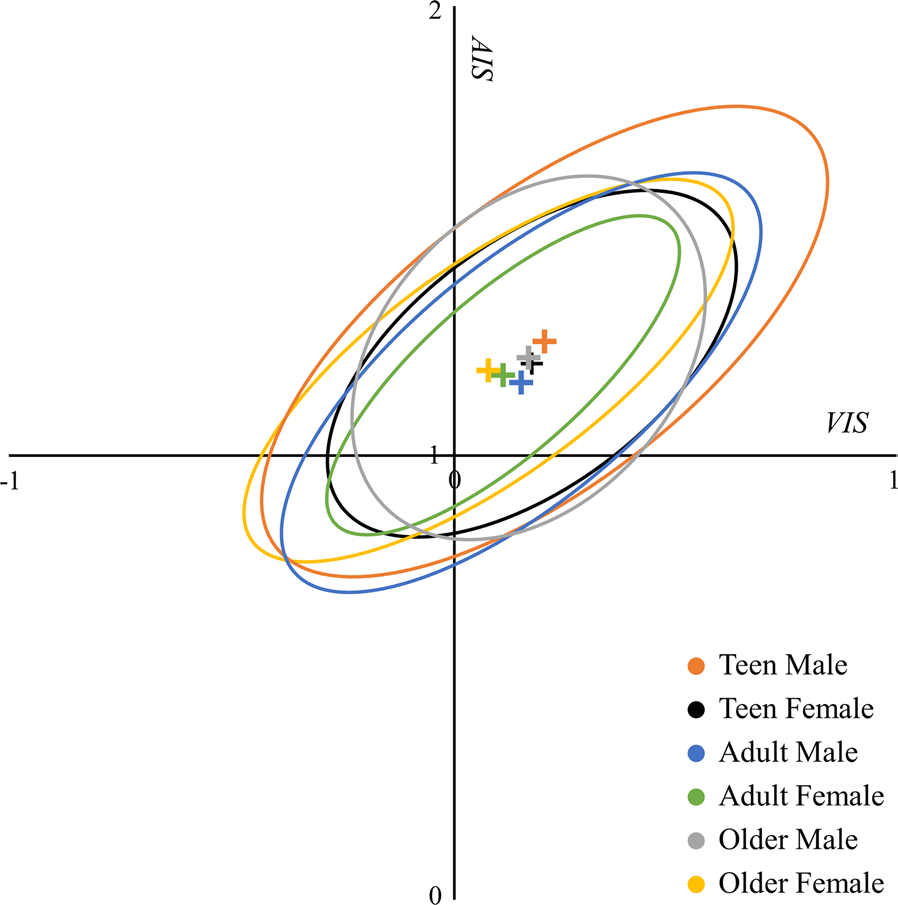
The standard deviation ellipse (SDE) analysis results showed significant differences in the central trend and dispersion of emotional distribution among different gender and age groups (Figure 3). For example, the emotional distribution of adolescent males (TM) exhibits a central trend of ZG and discrete regions of ZD, indicating significant fluctuations in their emotional states across different attractions. In contrast, the emotional distribution center of the elderly women (OF) group is more concentrated, and the discrete area is smaller, indicating that their emotional state is relatively stable. And the emotional ellipse centers of all groups are located in quadrant one, indicating that at Shanghai Disneyland, the overall emotional tone of tourists is positive and excited.
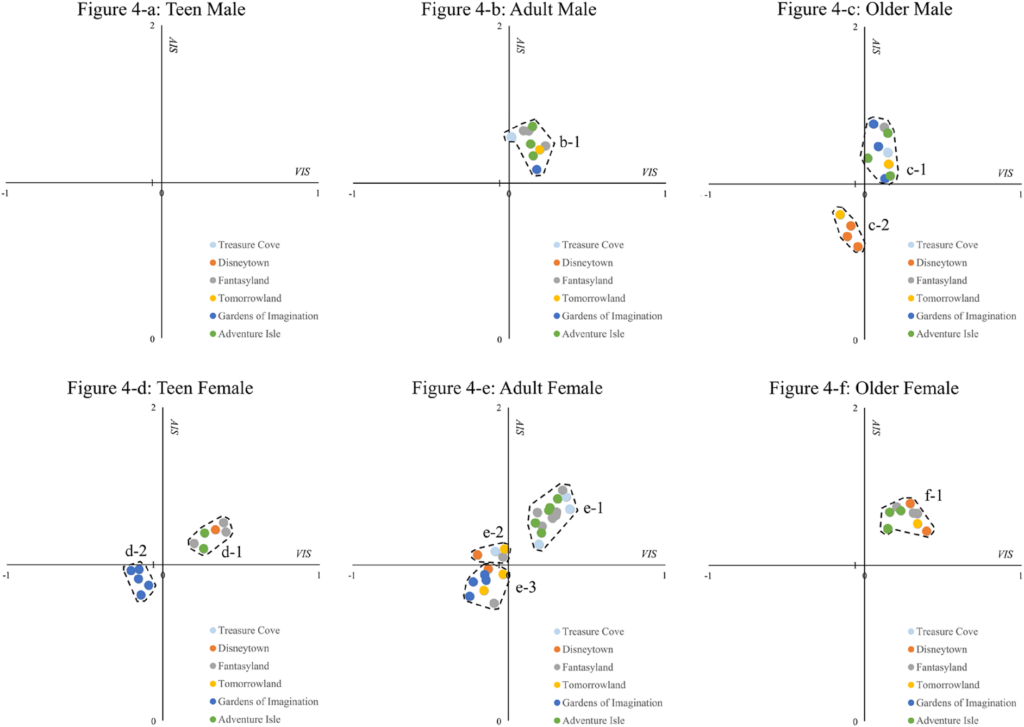
The clustering analysis results show that different gender and age groups exhibit different clustering phenomena in emotional distribution (Figure 4). For example, the emotional state of adolescent male groups did not form a significant clustering at all scenic spots, indicating that their emotional experiences are more diverse. Adult males (AM) and elderly males (OM) groups have formed emotional gathering areas at some attractions, indicating that these attractions have similar emotional stimulation effects on specific male groups.
The analysis of the valence intensity index (VIT) and arousal intensity index (AIT) of the theme sites shows that there are significant differences in the emotional impact of different themes on different gender and age groups. For example, the theme of "Treasure Bay" has a significant impact on the valence of adolescent male groups, while the theme of "Dream World" has a significant impact on their arousal. For the elderly female population, the theme of "Disney Town" has ZG value and arousal impact, while the theme of "Dream Garden" shows lower value and arousal.
In addition, there are differences in the impact of gender and age on emotional states (Figure 5). Specifically, there are significant differences in emotional states between adolescent males and females in the "Treasure Bay" and "Adventure Island" themed areas. Adolescent women generally have more positive emotions on these topics, exhibiting higher valence and arousal values. In contrast, adolescent males exhibit lower valence and arousal values, and even display negative emotions at certain tourist attractions. For the "Dream Garden" theme area, although designed with a more romantic female theme, it unexpectedly makes teenage men feel very happy and excited.
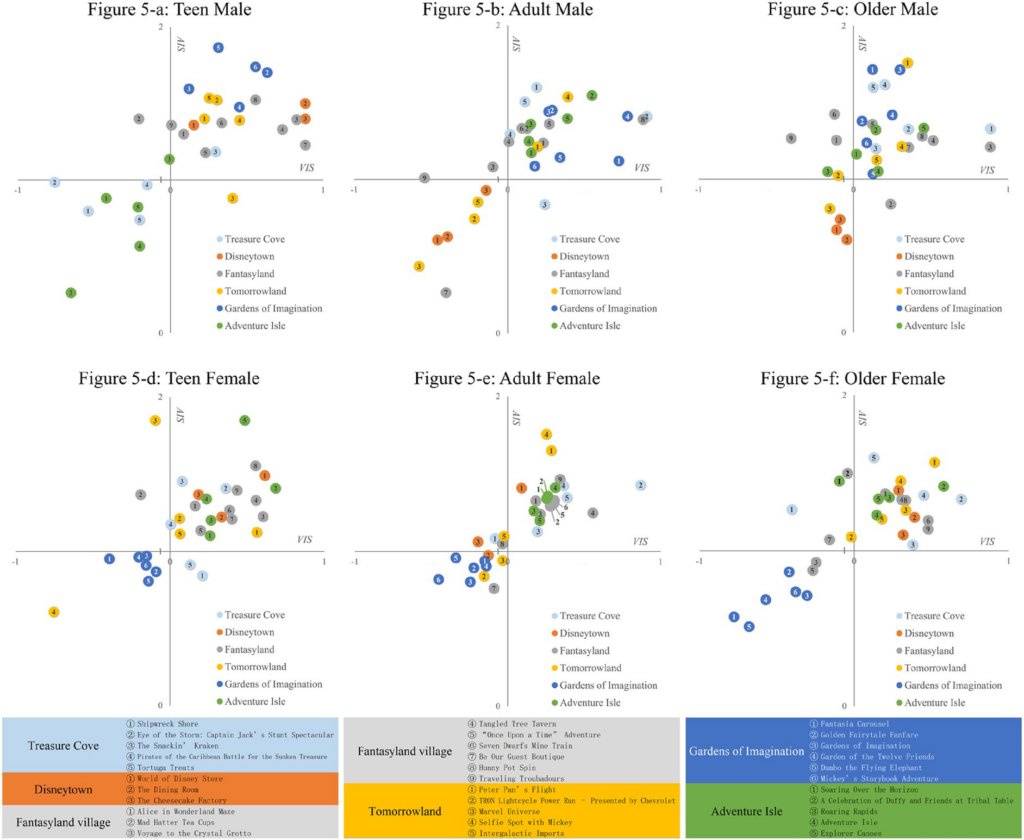
There is a significant difference in emotional states between adult males and females in the Disney Town theme area (Figure 5). Adult males exhibit lower valence and arousal values, and social media text analysis has found that they often complain about high product prices. In contrast, adult women exhibit higher potency and arousal values. In addition, adult males show higher interest in the "Tomorrow's World" themed area. Social media text analysis found that this may be related to their childhood memories, showing more positive emotions towards early Disney movie characters such as Mickey Mouse and Peter Pan.
There is a significant difference in the emotional state between elderly men and women in the "Dream Garden" theme area (Figure 5). Older women exhibit lower valence and arousal values, believing that this place is "filled with little girl things". In contrast, elderly men may exhibit higher efficacy due to the peaceful atmosphere of the theme site, but still have lower arousal values.
Overall, the emotional states and differences among different gender and age groups in theme parks may be caused by a combination of multiple factors. Their life stage, social role, consumption concept, and cultural memory deeply influence emotional responses. On the one hand, different groups have varying expectations and preferences for tourism experiences, resulting in different emotional reactions towards specific attractions. On the other hand, scenic spot design and activity arrangement may also have different emotional stimulation effects on specific groups. For example, adventure activities may be more popular among teenage women, while leisure activities may be more favored by adult women and the elderly.
More refined and humane tourism experience management
The emotion distribution map proposed in this study can visually display the emotional states and differences of different gender and age groups in theme parks. Compared to traditional emotion measurement methods, this method not only considers the valence and arousal dimensions of emotions, but also associates emotional states with specific scenic spots through geographic tagging technology. This makes emotional research more refined and specific, providing valuable decision support for tourism managers.
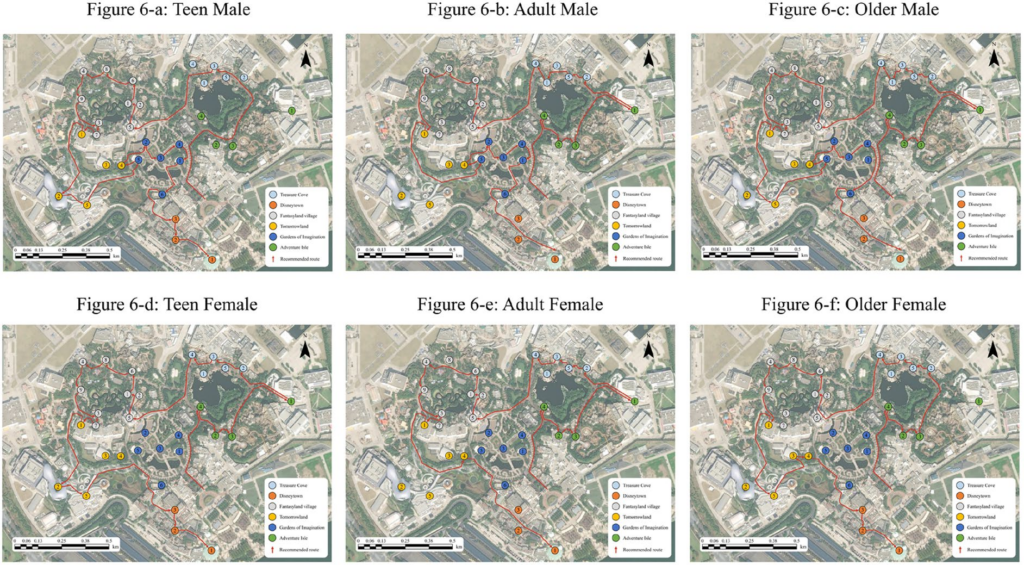
Firstly, by understanding the emotional states and differences of different gender and age groups within the theme park, managers can more accurately target the market and design differentiated tourism products. Secondly, based on the emotional distribution map, managers can optimize the layout of scenic spots and activity arrangements, and carry out personalized tour route planning to enhance the overall emotional experience and satisfaction of tourists (Figure 6). Finally, managers can take corresponding measures to improve and optimize the negative emotional areas of specific groups, in order to reduce the occurrence of negative emotions and enhance tourist loyalty.
Future research can also explore the use of new technologies such as virtual reality (VR) and augmented reality (AR) to further enhance tourists' emotional experience and satisfaction.
References
Song, X., Wu, H., Jiang, W., Zhi, J., Xia, X., Long, Y., & Su, Q. (2024). Using geotagged facial expressions to visualize and characterize different demographic groups’ emotion in theme parks. Scientific Reports, 14(1), 20983.
Welcome to our official account