-
E-mail
lina-he@zolix.com.cn
-
Phone
13810146393
-
Address
Feihong Road, Nanhu Avenue, Liangxi District, Wuxi City, Jiangsu Province
Jiangsu Shuangli Hepu Technology Co., Ltd
How to efficiently process hyperspectral images: Practical tips for beginners to share
Date: 2025-11-18Read: 1
2. Data format and file structure
The commonly used storage format for hyperspectral cameras is the ENVI standard format, which includes two files:. hdr and. raw. Some devices also come with. dci collection information files.
2.2 Introduction to ENVI format(.hdr + .raw)
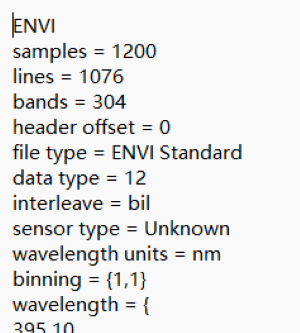
Introduction to saving metadata (wavelength, size, data type, etc.) in HDR
The. hdr file is plain text, defined by the ENVI standard, and records all key information samples (width W) of the entire hyperspectral image
·Lines (height H)
·Bands (spectral number)
·Interleaved (storage method, such as BIP/BSQ/BIL)
·Data type (data type, such as uint16, float32)
·Wavelength (the wavelength corresponding to each band)
·Sensor type)
Introduction to saving spectral data matrix in. raw
. raw is a pure binary file that records the raw digital quantization values of all pixels and bands. It only contains the data itself, without information such as size or wavelength, and must be used in conjunction with. hdr files.
Data is generally stored in one of the following three ways:
·BSQ (Storage by Band)
·BIL (Store by Row)
·BIP (pixel based storage)
Different storage methods may have an impact on read speed and data processing efficiency.
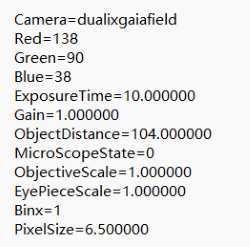
Introduction to saving data collection information in. dci
Hyperspectral cameras generate custom. dci files that record:
·Camera (camera model)
·R \ \ G \ B (RGB during data collection)
·Exposure Time
·Gain (gain)
·Object Distance Mobile Platform Speed or Step Size (Push Scan Camera)
·POS:
·Longitude, Latitude
·Altitude
·Height (relative height)
This file is mainly used for experimental recording and usually does not participate in data processing.
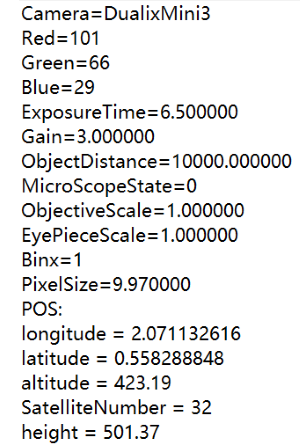
Ground mounted hyperspectral camera and airborne hyperspectral camera
2.2 Data Dimensions(H × W × Bands)
Hyperspectral imaging ultimately forms a three-dimensional data cube:
·H (Height): Image height
·W (Width): Image width
·Bands: How many spectral dimensions does each pixel have
Therefore, the amount of hyperspectral data is much larger than that of ordinary images, which is also one of the challenges for subsequent algorithm design.

2.3 Common Collection Modes and Their Effects(Push sweep vs face array)
The acquisition methods of hyperspectral cameras are mainly divided into two categories: push scan (line scan) and area array (snapshot), each of which is suitable for different application scenarios.
1) Push broom hyperspectral camera
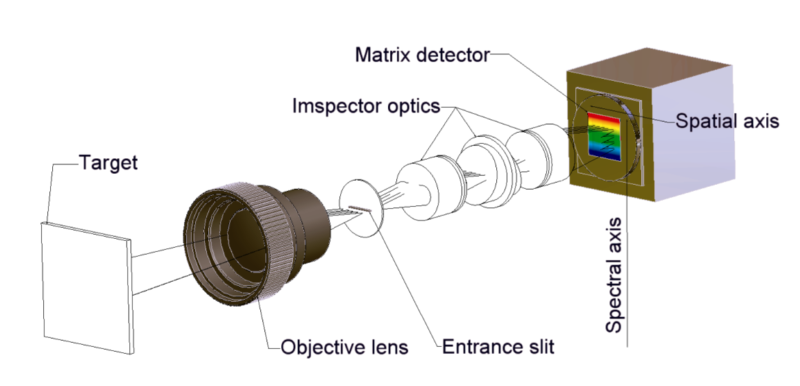
Also known as a line array camera, it only captures one line (in the X direction) at a time and completes the Y direction scan during the movement of the sample or camera. The imaging process is as follows: each time an image is formed on a line (in the X direction), the arranged detectors scan a strip trajectory during the movement of the conveyor belt in the detection system, thus completing the longitudinal scanning (in the Y direction). By integrating the horizontal and vertical scanning information, the three-dimensional hyperspectral image data of the sample can be obtained.
Imaging principle:
·There is a slit inside the camera
·The light is split by a grating and projected onto a linear array detector
·The motion platform (or conveyor belt) pushes the sample to scan the camera line by line
·Ultimately forming a complete hyperspectral cube
Features:
High spectral resolution
Low noise
Suitable for industrial assembly lines, crop scanning, laboratory push scanning, etc
2) Area array hyperspectral camera
Also known as snapshot hyperspectral camera, it can capture all spatial dimensions with one exposure.
Common techniques include:
·Spectral prism array
·Multi zone filter (such as IMEC)
·Multi channel beam splitting system
3. Data reading and visualization
The reading and visualization of hyperspectral data can be directly processed using integrated hyperspectral remote sensing software, or programmed using Python or MATLAB. The original hyperspectral curve is the DN value information, which is the digital value converted by the camera detector from the light signal. Essentially, it is the "pixel grayscale". It is not a physical quantity, so it needs to be converted into reflectance or radiance data for data analysis and processing. The following is a simple code reading example.
3.1 Reading Example
Example code for reading hyperspectral images in Python

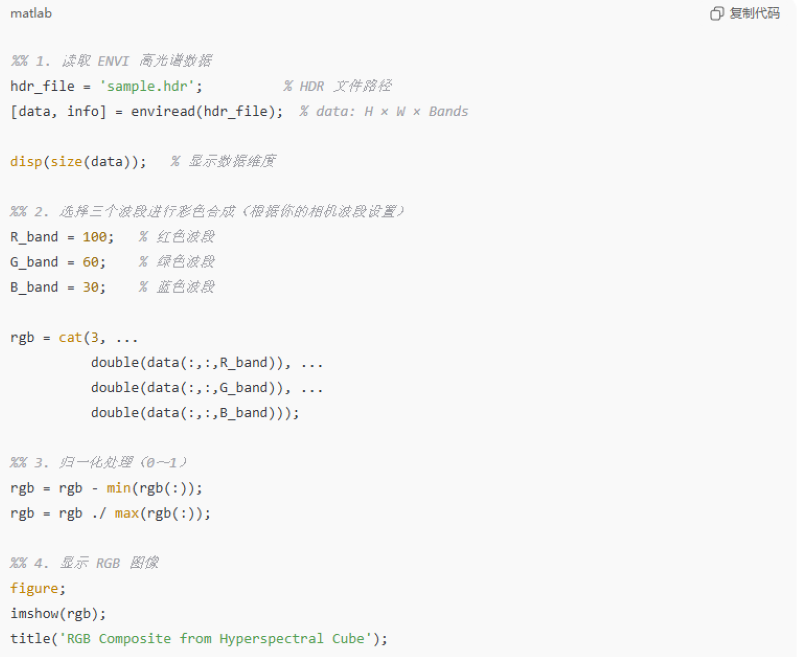
MATLAB reads hyperspectral image code
3.2 Color synthesis
True Color Synthesis
Select the wavelength corresponding to the human eye:
·R = 660 nm
·G = 550 nm
·B = 450 nm
The presented image is consistent with the visual perception of the naked eye.
Suitable for: natural scenery, agricultural remote sensing, and human visible light range analysis.
False Color Synthesis
Select other representative bands, such as:
·R=800 nm (near-infrared)
·G = 660 nm
·B = 550 nm
Near infrared technology is commonly used for vegetation health monitoring, target hyperspectral enhancement, and land cover classification, as it reflects the physiological conditions of plants
False color can enhance certain spectral differences, which is a unique advantage of hyperspectral data.
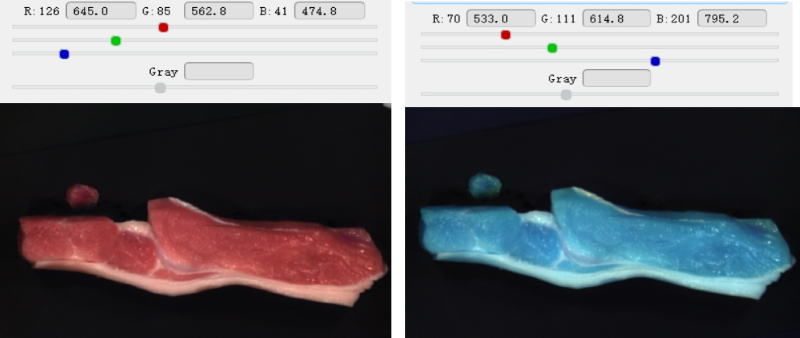
True color synthesis False color synthesis
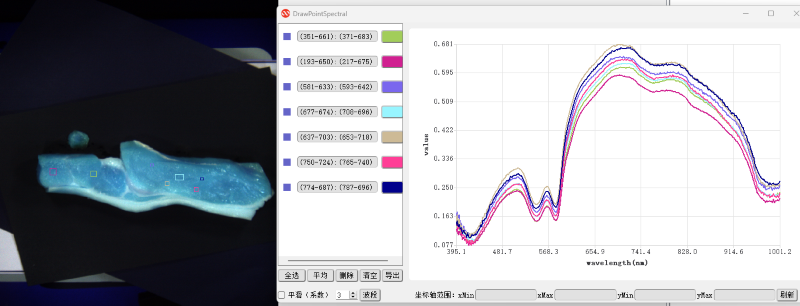
3.3 Spectral Curve Drawing
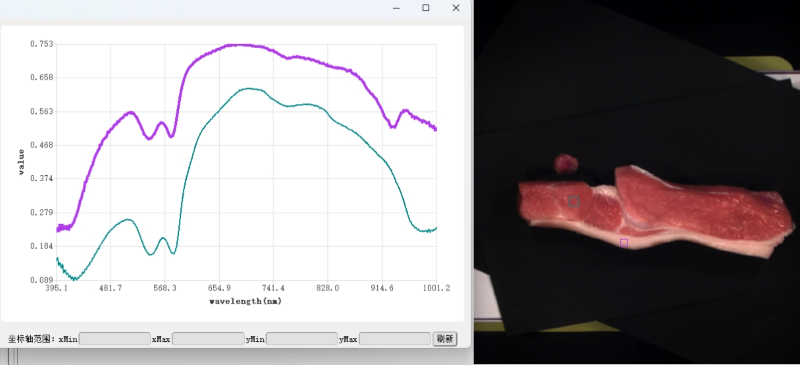
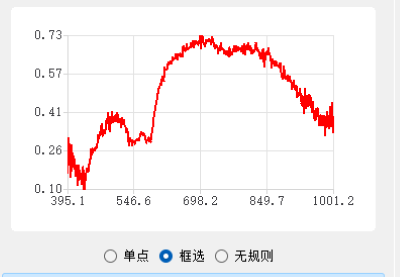
In hyperspectral images, each pixel corresponds to a spectral curve.
Click anywhere in the software to see the changes in spectral reflectance/radiance with wavelength. You can also choose regions and irregular images to average all pixels such as ROI.
Conclusion
Hyperspectral imaging may seem "cool", but fundamentally, it only observes the world in a more detailed way: not only by looking at shape and color, but also by seeing the true appearance of matter in the spectral dimension. I hope this article can help you take a more solid step on the road to understanding hyperspectral technology. In the next section, we will introduce preprocessing methods for hyperspectral images.