-
E-mail
sales@eco-tech.com.cn
-
Phone
18210150760
-
Address
101B, Unit 1, Building 6, Courtyard 3, Gaolizhang Road, Haidian District, Beijing
Beijing Yiketai Ecological Technology Co., Ltd
Experimental Method Sharing | Evaluating the Response and Recovery of Barley to Flooding Stress Based on Image Phenotypic Analysis Method
Date: 2025-11-25Read: 0
Method source
Langan, P.et al.Evaluating waterlogging stress response and recovery in barley (Hordeum vulgare L.): an image-based phenotyping approach.Plant Methods20, 146 (2024).
research unit
1. University of Dublin, Ireland
2. University of Amiens, France
Key instruments and equipment
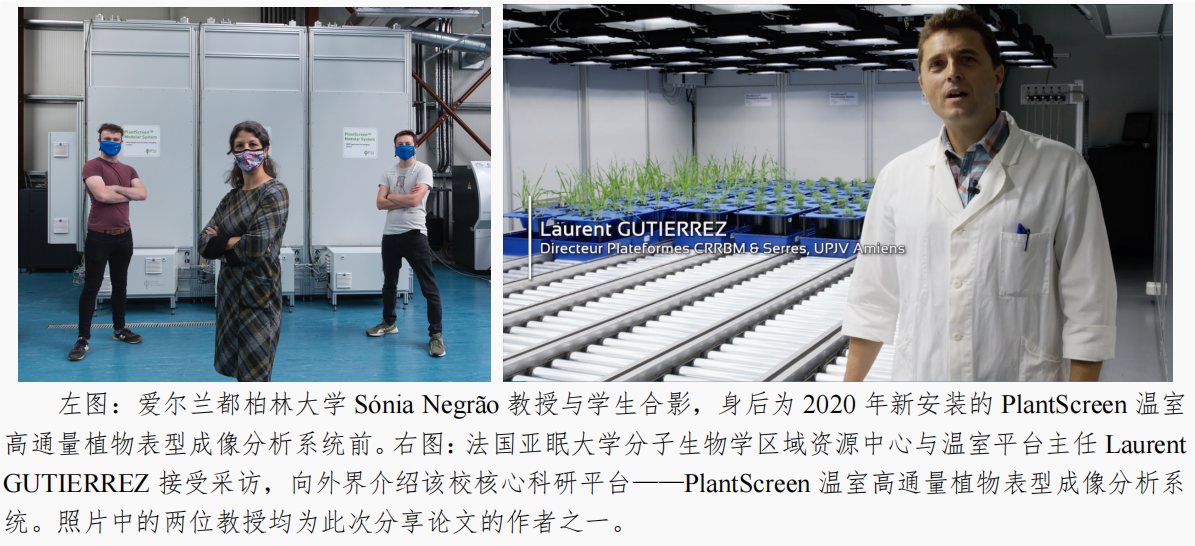
PlantScreenGreenhouse high-throughput plant phenotype imaging analysis system
PlantScreenThe greenhouse high-throughput plant phenotype imaging analysis system isPlant science research is comprehensive, automated, and high-throughputPhenotypic solutionSolution,Capable of long-term and non-destructive monitoring and analysis of phenotypic traits in crops ranging from model plant Arabidopsis to wheat, corn, and others.
systemdistributed inTop research institutions, universities, and agricultural enterprises from all continents around the world.asDutch Plant Ecological Phenotype Center/Wageningen University, Netherlands(Note: The link is a special report, the same below)Leibniz Institute for Plant Genetics and Crop Research, Germany(IPK)University of Helsinki, Finland, Australian National University、Institute of Biotechnology, Chinese Academy of Agricultural Sciences、China Rice Research InstituteWaiting for agricultural universities and top research institutions,andDuPont Pioneer, Monsanto, BASF and other agricultural companies.
Research Background
With climate change, the frequency of rainfall in many regions has increased, and waterlogging stress has become an important limiting factor affecting barley yield.The impact of waterlogging stress on crop yield varies depending on crop species, management measures, genetic diversity, and stress conditions. Flooding can lead to insufficient oxygen in the soil, thereby affecting the growth and development of plants.Barley crops are more sensitive to waterlogging stress.In previous studies, the treatment methods and duration of waterlogging stress varied, making it difficult to compare the results between different studies. Therefore, this study aims to determine an optimal duration and setting for simulating waterlogging stress through image phenotype analysis, in order to evaluate barley's waterlogging tolerance under controlled conditions.
Research Objective
The main purpose of this study is toDetermine the optimal experimental plan for water flooding stressIn order to control under controlled conditionsEvaluate the waterlogging tolerance of barley,Simultaneously quantifying the effects of waterlogging stress on barley growth and greenness through image phenotype analysis methods.
research methodology
1. Experimental Design
The experiment is divided into two parts, conducted at the University of Dublin in Ireland and the University of Amiens in France. Four two row spring barley varieties were selected, including two commercial varieties(RGT PlanetandConcerto)And two traditional varieties(Glaswine no.5andGolden Promise). experiment1Conducted at the University of Dublin, testedTwo varieties(RGT PlanetandGlaswine no.5)Six different combinations of duration and recovery time of waterlogging stress, including5Oh my god10Harmony of Heaven14The coercion of heaven, and whether or not it exists7Day recovery periodExperiment2Conducted at the University of Amiens in France,Verified the experiment1The selected best solution(14Heavenly coercion plus7The repeatability of the recovery (day recovery) has been improved, and two varieties and sample sizes have been added(The number of repetitions is from5An increase to10A).

2. Coercive treatment
During the three leaf period (i.eZadoks 13)Apply waterlogging stress to barley by placing the pot in an outer pot with a sealed drainage hole to maintain the water level above the soil surface1At centimeter level, corresponding to approximately120%The field water holding capacity. The drainage holes of the flowerpot in the control group were not sealed and kept at approximately60%The field water holding capacity. in the experiment2In the middle, the water level remains at approximately140%The field water holding capacity of the control group was maintained at approximately100%The field water holding capacity.Different moisture treatmentsPlantScreen™High precision automatic irrigation system daily08:30Monitor and regulate, the system achieves quantitative replenishment based on the target weight.
3. Image phenotype analysis
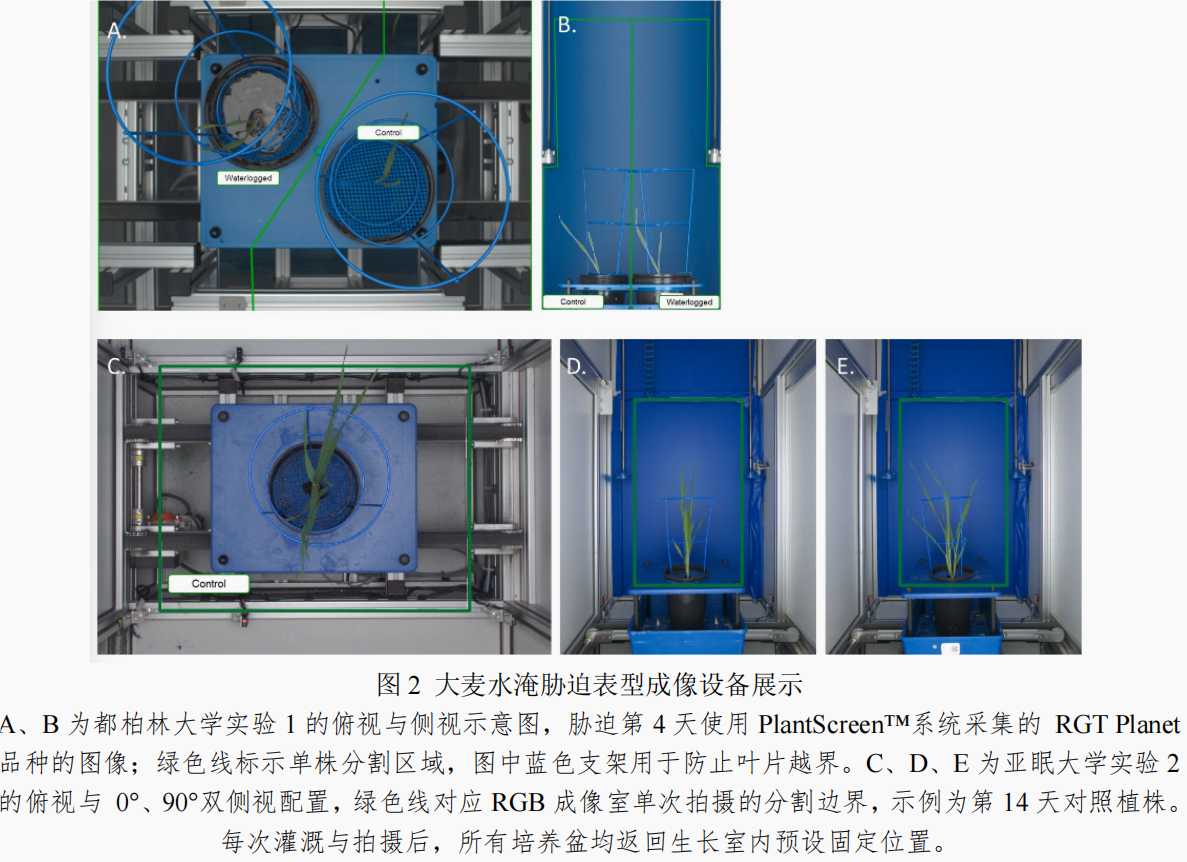
usePlantScreen™Imaging platform, taking photos from the top and side every dayRGBImage to quantify the physiological effects of waterlogging stress on growth and greennessUsing image analysis softwarePlantScreen™ AnalyzercalculateAbove ground projection area(PSASum of side view and top view segmentation pixelsTo evaluate the growth of plants. In addition, in the experiment2In addition, it has also been carried outFluorCamDynamic chlorophyll fluorescence imaging for evaluating the photosynthetic performance of plants.
4. Root imaging and destructive phenotype analysis
in the experiment1At the end of each treatment, manually clean the root system and record the root length and dry mass. useEPSONFlat panel scanner andRhizoVision ExplorerThe software obtains root parameters, including length, volume, diameter, and surface area. On the last day of imaging, measure the aboveground stem length, fresh weight, and dry weight. experiment2On the last day of imaging, the aboveground dry weight was measured.
Research findings
1. Determination of the best coercion plan
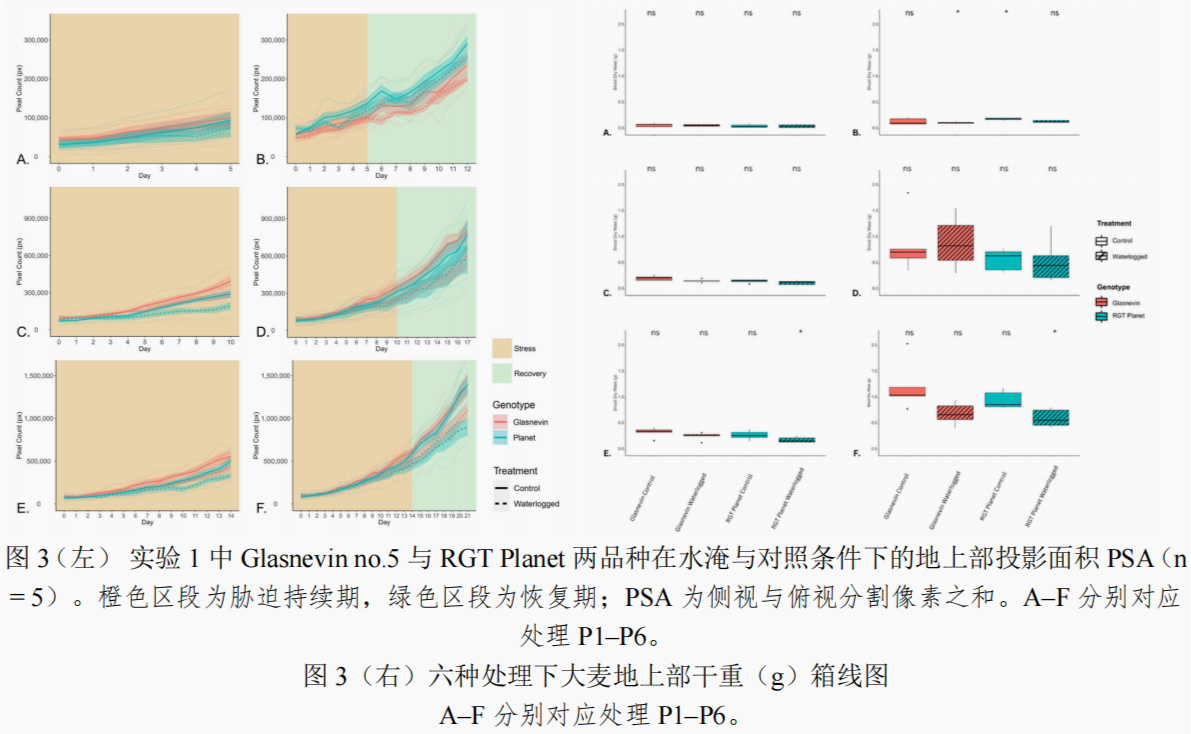
The experimental results showed that with the prolongation of waterlogging stress time, the slowdown of plant growth became more pronounced, and this effect continued during the recovery period. in the experiment1In the middle, only14The coercion of heaven(P5andP6)Significant differences in actual dry weight were observed between the control group and the flooded group (Figure)3rightEandF). Especially including7The longest processing time for the recovery period of days(P6)The change in dry weight is most significant during harvest, andBy projecting the area above groundPSA(Indicating aboveground biomass) can most clearly distinguish tolerance differences between genotypes(Image)3leftF)Therefore, it was selected as the best treatment plan for subsequent experiments.
2. The effect of waterlogging on biomass and photosynthetic performance of barley
in the experiment2Among them, the biomass of four barley varieties significantly decreased under waterlogging stress, and compared with the control group, the dry weight of the waterlogging group decreased by about73%to81%Through image analysis,Observing plants under waterlogging stressPSASignificantly decreased, indicating growth inhibition(Image)4A).
Chlorophyll fluorescence imaging shows that during stress, all varietiesFv/FmThe values (maximum photochemical efficiency) have decreased, but have rebounded during the recovery period. especiallyGolden PromiseVariety throughout the entire experimental processFv/FmThe minimum decrease in value indicates its tolerance to waterlogging stress(Image)4B).

3. Analysis of Green Degree Changes
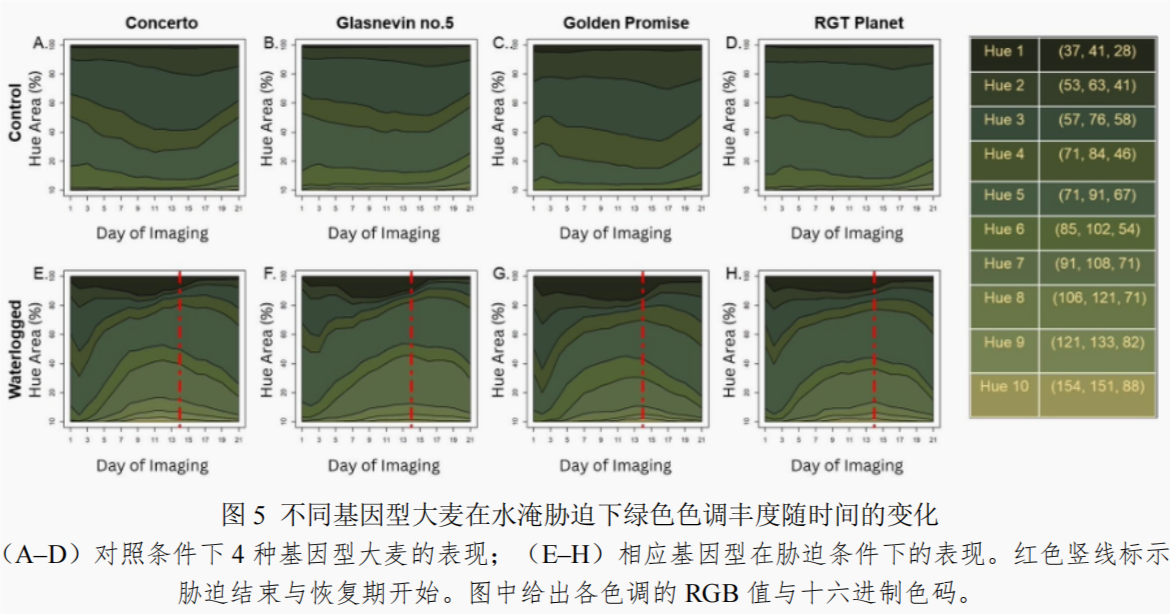
By analyzing the greenness in the image, it was found that waterlogging stress caused changes in the number of pixels for certain specific tones. Specifically, darker green tones(Hue 2、3and4)Less noticeable in flooded plants, with lighter green tones(Hue 7、8、9and10)And the deepest color tone(Hue 1)Increased under waterlogging stress. These changes were most significant during the stress period and gradually returned to normal during the recovery period (Figure)5). Therefore,There are significant differences in the composition and dynamic changes of green color tone in leaves of different genotypes of barley under waterlogging stress, which can be used as a rapid and non-destructive diagnostic indicator for waterlogging tolerance.
research findings
This study determined an optimal experimental plan for water flooding stress through image phenotype analysis method(14Heavenly coercion plus7The scheme can significantly distinguish the response of different barley varieties to waterlogging stress. The research results indicate that waterlogging stress significantly reduces the biomass and photosynthetic performance of barley, and the adaptability and recovery ability of plants to stress can be observed through greenness analysis. In addition, this study emphasizes the importance of including the recovery period after stress, as it helps to observe the growth recovery of plants after stress.Through high-throughput image phenotype analysis, this study provides a new and reproducible method for evaluating early waterlogging tolerance of barley, which helps to more accurately quantify markers related to waterlogging stress, such as greennessFv/FmandPSA.
Beijing Yiketai provides comprehensive technical solutions for plant phenotype scenarios
uPlantScreenHigh throughput phenotype imaging analysis system for greenhouse plants
uFully upgradedFluorCamChlorophyll fluorescence imaging/Multispectral Fluorescence Imaging Technology
uPhenoTron®Indoor plant phenotype imaging analysis technology
uFluorTron ®Imaging analysis technology for plant photosynthetic phenotype
uPhenoPlot®Phenotypic imaging analysis technology for field plants
uIntelligent mobile phenotype platform
uEcodrone®Remote sensing technology for unmanned aerial vehicle phenotype
uComprehensive solution for photosynthesis measurement