-
Phone
15920101686
-
Address
Room 902, Yifeng Business Building, No. 284 Huannan Road, Wusha Community, Chang'an Town, Dongguan City
Product Categories
- Roughness tester
- Anime image measuring instrument
- Hexagon coordinate system
- Coating thickness gauge
- Leica metallographic microscope
- Instrument consumables and accessories
- Colorimeter glossiness
- an altimeter
- Italian AFFRI Rockwell hardness tester
- Non metallic/rubber hardness tester
- Brinell hardness tester
- Rubber hardness tester
- Japanese Songze hardness tester
- rockwell hardness tester
- Vickers hardness tester
- lever indicator
- Inner diameter and aperture table
- calipers
- height gauge
- micrometer
- altimeter
Dongguan Keshang Measurement Equipment Co., Ltd

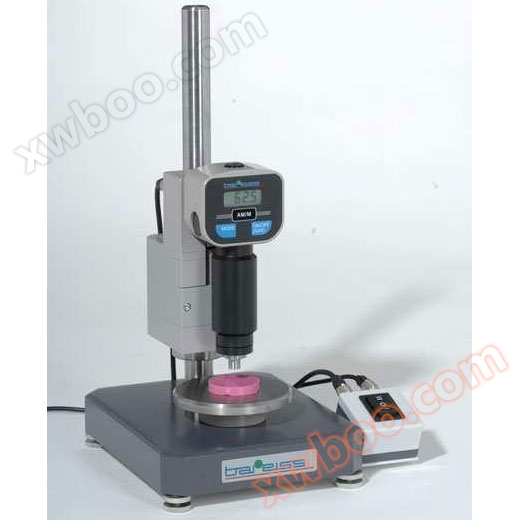
Yuanxing Manual Imager YVM-VT
NegotiableUpdate on 01/04
- Model
- Nature of the Manufacturer
- Producers
- Product Category
- Place of Origin
Overview
Product Introduction: High cost-effective Taiwan imaging device with Z-axis measurement function
Product Details
Image based 3D measuring instrument YVM-VT series
describe in detail
Instrument usage:This instrument is suitable for all application fields aimed at two-dimensional measurement. Widely used in industries such as machinery, electronics, watches, plastics, molds, etc.
Instrument features:The powerful YR-VT measurement software can achieve all two-dimensional plane measurement functions, and also has functions such as map shooting, product contour scanning, professional SPC statistics, manual CNC, macro measurement, etc. The Z-axis lifting adopts marble columns, which can achieve non-contact precise measurement and flatness measurement of Z.
Specification parameters:
|
Instrument model |
YVM-2010VT | YVM-3020VT | YVM-4030VT | YVM-5040VT | |
| Measure the itinerary | 200*100*220mm(X.Y.Z) | 300*200*220mm(X.Y.Z) | 400*300*220mm(X.Y.Z) | 500*400*220mm(X.Y.Z) | |
| X. Y.Z minimum display value | 0.001mm | ||||
| measurement accuracy | X.Y Axis:(3+L/200)μm | ||||
| Repetitive accuracy | 3μm | ||||
| Image magnification | 24~156X (expandable to 12~312X) | ||||
| Measurement method | Image-based | ||||
| CCD | 430000 pixel color high-definition camera (SONY chip) | ||||
| lens | High definition 0.7~4.5Xzoom zoom lens | ||||
| work distance | 115mm (image) | ||||
| computer | Brand Computer | ||||
| Measurement software | YR-VT (capable of precise Z-axis measurement and flatness measurement) | ||||
| Lifting column | Granite column | ||||
| Instrument base | Class 000 high stability granite base | ||||
| lighting | Both the upper and lower light sources use adjustable brightness LED shadowless lights | ||||
| outline dimension | 500*550*950mm | 700*650*950mm | 980*750*950mm | 1050*800*950mm | |
| Instrument weight | 175KG | 180KG | 300KG | 500KG | |
YR-VTIntroduction to Measurement Software
1Automatic measurement function: Mouse automatically finds straight lines, selects circles with points, selects circles with boxes, automatically circles in areas, and automatically arcs
2. ManualCNCSemi automatic measurement can be performed with fixtures
3. Optical height measurement function
4. Optical measurement of flatness
5Assisted focusing: helps find the clearest timeZposition (Auxiliary focusing improves measurement accuracy)
6Image output: The measurement results can be output in image format (Equivalent to the function of a digital camera)
7Geometric tolerances: roundness, straightness, parallelism, perpendicularity, concentricity
8Setting tolerances: The actual dimensions of the product can be set to exceed the range, and if exceeded, a red background warning will be displayed
9、CCDCorrection: Correct image distortion
10Contour tracking: Automatically calculate the contour of the workpiece through software and display it (Clearly display the measurement location)
11、Vector drawing function: graphic fonts can be infinitely enlarged or reduced
12、Annotation functions: radius annotation, diameter annotation, angle annotation, linear annotation, alignment annotation, text annotation, coordinate annotation
13Command line: You can directly input coordinate information from the command line to generate points, lines, circles, arcs, etc., to meet special needs
14Map measurement: It can accurately integrate the partial photos of the workpiece taken into a full image of the workpiece and save it as a high-resolution photo. You can also open previously captured maps and perform operations such as drawing, annotation, and modification directly (Synthesize large images)
15Virtual measurement: Virtual measurement technology allows image measurement software to be detached from hardware machines. Even without a machine or product, the software can still measure the size of the product (Can be measured offline)
162D copying: The product shape can be drawn, and the drawn graphics can be transferred toAutoCADForming engineering drawings can be done through reverse engineering
17、SPCAnalysis: Can be calculatedCA、CP、CPK、DRL、DRR、DR、MAX、MIN、AVG、RANGE、STDAnd it can also be drawnX-RCharts, scatter plots, line charts, bar charts, etc
Similar Product Recommend