-
Phone
18049952031/18017806506
-
Address
3rd Floor, Building 79, Lane 4855 Guangfulin Road, Songjiang District, Shanghai (Daye Territory)
Product Categories
- Dissolved oxygen analyzer
- Portable Turbidimeter
- Personal sound exposure meter
- COD analyzer
- Dust air sampler
- PH/ORP analyzer
- Multi parameter measuring instrument
- acoustic calibrator
- BOD analyzer
- Wind speed tester
- Data Recorder
- Dangerous gas detector
- Single parameter ion analyzer
- Temperature and humidity detector
- Real time measurement system
- Coating thickness gauge
- Conductivity/TDS tester
- Carbon monoxide detector
- Four in one gas detector
- Ordinary sound level meter
- noise spectrum analyzer
- infrared thermometer
- Oxygen detector
- Integral statistical analyzer
- Photometer/colorimeter
- Vibration instrument
- Ammonia gas detector
- other
Shanghai Bangwo Instrument Equipment Co., Ltd
Hangzhou Aihua AWA6290 Multi channel Signal Analyzer
NegotiableUpdate on 03/02
- Model
- Nature of the Manufacturer
- Producers
- Product Category
- Place of Origin
Overview
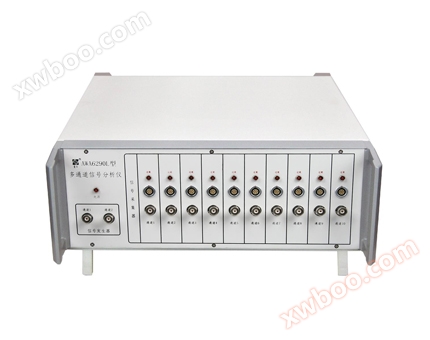
Hangzhou Aihua AWA6290 Multi channel Signal Analyzer
Product Details
The AWA6290 series multi-channel signal analyzer is a signal analysis instrument developed using computer multimedia technology. Strict synchronization between multiple channels, high-precision sampling, can be used for the acquisition, spectrum analysis, and related applications of analog signals such as noise and vibration. The analyzer consists of two parts: a signal generator and a signal collector. The generator has two independent channels, while the collector has an independent channel. Using Ethernet for data communication, convenient to use.
TECHNICAL INDEX
|
Input program control part |
Input channels: 2-20 |
| Input signal type: ICP or voltage, recommended preamplifier: AWA14600E or AWA14604E | |
| Input socket type: BNC and LEMO | |
| Maximum input voltage: 10V (effective value) | |
|
Measurement range: 5 μ V-10V (effective value) 20dB (A) to 140dB (A) (equipped with a microphone with 50mV sensitivity) 0.03m/s2~10000m/s2(Equipped with 1mV/(m/s2) accelerometer) When the sensitivity of the sensor changes, the measurement range will vary accordingly |
|
| Frequency range: 1Hz-80kHz<0.1dB (1kHz as reference, 192k sampling) (The upper frequency limit is related to the sampling frequency, and the error is less than 0.1dB when f/fs<0.45) | |
| Input impedance:>600k Ω | |<200pF | |
| ICP power supply: working current 5mA, voltage 28V | |
| LEMO power supply: 30V, with an internal 1k Ω current limiting resistor | |
|
Range: -20dB, 0dB, 20dB optional, reference range is 0dB Range control error:< 0.1dB@1kHz |
|
| Overload indication: When the signal exceeds the measurement range and causes overload, the indicator light on the instrument panel can light up | |
| Signal acquisition section | A/D bits: 24 bits |
| Number of channels: 2-20, each channel has an independent A/D converter | |
| Sampling frequency: 8192, 16384, 32768, 65536, 1311072, 12k, 24k, 48k, 96k, 192kHz per channel (192kHz sampling supports 8-channel synchronous sampling, 48k supports 20 channel synchronous sampling). ) | |
| Dynamic range: greater than 110dB | |
| Signal generation part | Working mode: 24 bit D/A is controlled by a computer through a network port to output signals |
| Sampling frequency: Two channel synchronous sampling, 192kHz | |
| Number of output channels: 2 | |
| Output amplitude: 0.01V to 9V (rms) | |
| Frequency range: 0.5Hz~75kHz (1kHz as reference, error less than 0.2dB) | |
| Harmonic distortion:<0.1% @ 8V (total distortion<0.2% @ 8V) | |
| other | External power supply: 12V, 3A, diameter 2.5 power plug, positive inside and negative outside |
| Digital input/output interface: 100Mbps Ethernet port | |
| Dimensions: 340 × 140 × 360 (mm) | |
|
Mass: Approximately 4.5kg |
Function selection and application
|
Model or name |
major function |
|
FFT analysis software |
FFT line count: 512, 1024, 2048, 4096, 8192, 16384, 32768, 65536 optional Analysis results: effective value, power spectral density, power spectrum, harmonic quantity, etc |
|
OCT and 1/3 OCT analysis |
Compliant with standards: IEC61260:1995 CLASS 1, GB/T3241-1998 Level 1 Frequency weighting: A, C, Z are optional Average method: Linear, exponential, constant error optional |
|
1/n OCT analysis software |
Compliant with standards: IEC61260:1995 CLASS 1, GB/T3241-1998 Level 1 Optional analysis frequency bands: 1/6, 1/12, 1/24, 1/48 |
|
Noise Total Analysis Software |
Frequency weighting: Parallel A, B, C, D Time weighting: F, S, I, and peak |
|
Vibration total value analysis software |
Integrator: parallel (simultaneous) measurement of acceleration, velocity, and displacement Detection characteristics: effective value, peak value, peak to peak value |
|
Human body vibration analysis software |
Measurement indicators: Wh weighting or parallel Wb, Wc, Wd, We, Wj, Wk, Wm weighting according to ISO8041
|
|
Speed analysis software |
Using a measurement channel, connect it to a photoelectric tachometer or directly analyze the speed data through noise and vibration data. The speed data can be saved together with other measurement results |
|
Damping measurement software |
Measure the natural frequency and damping coefficient of materials |
|
short time fourier transform |
The analysis time length is optional, the time-domain signal can be windowed, the window sliding length can be adjusted, and the analysis results can display slice spectra and grayscale images |
|
envelope spectrum analysis |
Window function and FFT line number can be adjusted to display the original waveform, envelope, and envelope spectrum
|
|
Transfer function analysis |
The input-output window function, data overlap rate, FFT line count, and sampling frequency are adjustable. The output results display the amplitude, phase, cross spectrum, cross-correlation, and cross-correlation curves of the transfer function.
|
|
Signal generator software |
Can control the generation of sine signals, white noise, pink noise, sweep frequency, sweep amplitude and other types of signals
|
|
Collection and analysis software |
Real time waveform acquisition and display, supporting multi-channel synchronous acquisition, with adjustable acquisition time.It can cut, paste, copy, save, enlarge, and shrink waveform data, and with corresponding software, it can perform post analysis on recorded waveforms |
|
Sound intensity analysis software |
1/3 OCT sound intensity analysis from 31.5Hz to 6.3kHz. (1/3 OCT analysis software package is required first) |
|
Measurement of sound power using sound intensity method |
Using a sound intensity probe for discrete point method sound power measurement,Compliant with standard: GBT 16404-1996 Acoustics - Determination of sound power level of noise sources by sound intensity method - Part 1: Measurement at discrete points |
|
Surface sound pressure method for measuring sound power |
Simultaneously measure the sound power level of 1/3 OCT frequency band and the weighted sound power levels of A, C, and Z.The number of measurement points is determined by the number of channels of the user (1/3 of the corresponding channel number needs to be purchased first for OCT analysis software authorization) |
|
Time history analysis software |
Real time display of spectrum analysis data for each channel Zoom in, zoom out, and save the time history curve separately Select the energy average, arithmetic average, maximum and minimum values, and data printing within the selected range |
|
Waterfall analysis software |
Take data from 1/3 OCT analysis window, FFT analysis window, etc., and display the time, frequency, and amplitude values in three-dimensional mode to save graphics and analysis results. |
|
Architectural Acoustic Measurement Software |
Measurement of airborne sound insulation, floor impact sound, and reverberation time |
|
Power Transformer Measurement Software |
Compliant with GB/T 1094.10-2003 Power Transformers Part 10: Sound Level Determination |
|
Speaker measurement software |
Can simultaneously measure speaker frequency response, second harmonic, third harmonic, etc Measurable impedance curve of loudspeaker Can save frequency response and harmonic curves for comparison |
|
Drainage pipeline measurement software |
Compliant with standard CJ/T 312-2009 Noise Testing Method for Building Drainage Pipeline System Equipped with reverberation measurement function (1/3 OCT analysis software must be provided first) |
|
Washing machine measurement software |
GB/T 4214.1-2000 "Acoustics - Noise testing of household appliances and similar appliances - Part 1- General requirements" GB/T 4214.4-2008 "Acoustics - Test Methods for Noise from Household Appliances and Similar Use - Special Requirements for Washing Machines and Centrifuges - Dehydrators" (1/3 OCT analysis software must be provided first) |
|
Sound insulation measurement software |
Automatically measure the transmission coefficient and sound insulation of vertical incidence. Comparison of measurement results, saving of curves, and printing of reports (Must be used in conjunction with 8551 impedance tube) |
|
Sound absorption coefficient measurement software |
Compliant with GBT-18696-2002. It can measure the reflection factor, sound absorption coefficient, acoustic impedance, and acoustic admittance of materials vertically incident. Comparison of measurement results, saving of curves, and printing of reports |
|
Mathematical Calculation Window |
You can extract results from other similar analysis windows, calculate them according to the specified formula, and display the results. Example: The difference between channel 1 and channel 2 can be calculated, and the sound pressure level difference between the two sides can be compared |
|
Customized software for customers |
We can customize software that meets special measurement standards according to customer requirements |
Similar Product Recommend