-
E-mail
13345717939@163.com
-
Phone
13345717939
-
Address
Room 1009, Building 2, Zhongtian MCC, No. 2 Youzhi Lane, Xihu District, Hangzhou
Product Categories
Hangzhou Kewengxing Instrument Co., Ltd

Data management software
NegotiableUpdate on 01/21
- Model
- Nature of the Manufacturer
- Producers
- Product Category
- Place of Origin
Overview
The color illuminance meter data management software can change various charts and data analysis screens in the screen layout as needed, and user-defined layouts can also be saved as templates.
Product Details
FPD measurement example
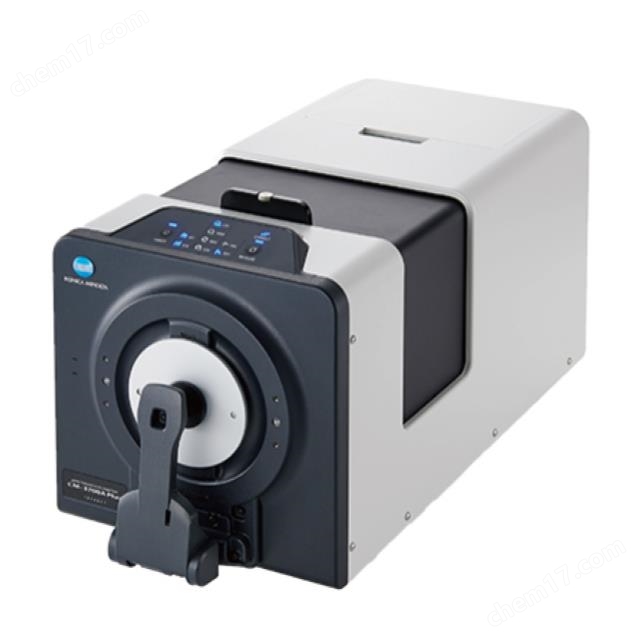
Step 1: Setting up and Measuring
Simple setting of measurement data
While viewing the viewfinder image on the screen, easily adjust the measurement area without moving the CA-2000.
Image display measurement screen and viewfinder view
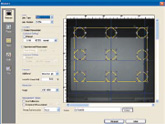
Step 2 Data Analysis
Data management softwareCan create and save screens suitable for application software
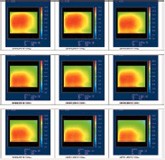
The basic screen for data analysis is provided at the factory and can be used immediately after purchase. Various charts and data analysis screens in the screen layout can be changed as needed, and user-defined layouts can also be saved as templates.
*Screen example displaying 9-point measurement in image display
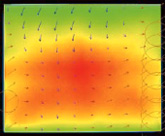
Data management softwareColor difference display
Color difference is displayed as a vector, and color differences exceeding the set upper limit will be highlighted in circles.
*Screen example of 100 point color difference measurement for image display.
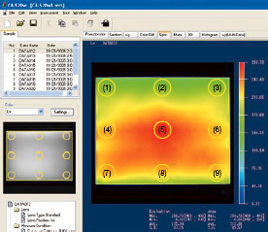
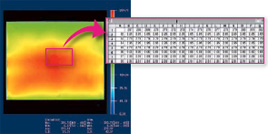
Simulated color display
Suitable for brightness observation and chromaticity distribution.
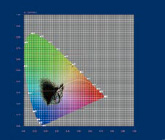
Chromaticity chart display
Clearly display chromaticity changes.
Light point display
By averaging the areas within the light spot, the measurement value of each point is determined to measure multiple light spots of user-defined size and quantity.
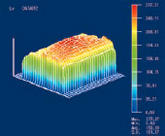
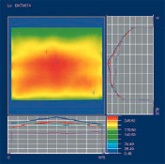
3D chart display
Display data in 3D stereoscopic format to better understand the overall situation.
Bar chart display
Display a bar chart (frequency distribution) for easier observation of changes in brightness and chromaticity.
Step 3 Evaluation and Reporting
Convert data to Excel ® And Word ® format
The data within the scope can be converted to Microsoft Excel ® And Word ® Form.
Copy and paste chart operations facilitate the preparation process of the report.
* Excel ® , Word ® It is a trademark of Microsoft Corporation in the United States and other countries.
feature
Multi screen display
Can display and compare thumbnail images of various charts.
Sectional view display
Horizontal and vertical sectional views that can display the cursor position.
Enhance uneven display
Can enhance uneven points or lines for easier identification of defects.
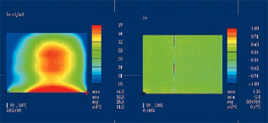
*Examples of pseudo color display (left) and enhanced non-uniform display (right) when measuring uneven line images on the screen.
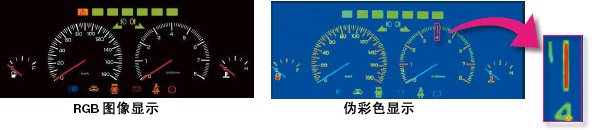
Example: Measurement Example of Automotive Instrument Panel
Example: Measurement Example of Mobile Keyboard
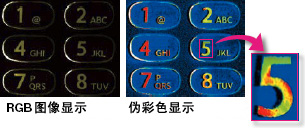
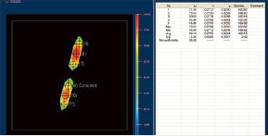
Light point display
The statistics of the areas within the light spot are displayed in a list, and the light spot is assigned a serial number and label, which makes measurement and positioning easier.
Specifications
CA-S20w system requirements
| operating system | Windows ® XP Professional SP2 (Japanese, English, and Korean versions) Windows ® XP Professional x 64 Edition (Japanese and English versions) |
|---|---|
| CPU | Equivalent to Pentium ® 4 2.8 GHz or higher |
| memory | 1024 MB or higher |
| hard disk | The system drive (with installed operating system) requires at least 80MB of free space In addition, each lens requires the following free space to install calibration data. For standard lens: approximately 540MB For wide-angle lenses: approximately 470MB For telephoto lenses: approximately 1.3GB Similarly, if you want to save measurement data on the hard drive, additional free space is required. (1000 measurement data with a resolution of 980 x 980 require at least approximately 11GB) |
| display screen | Capable of displaying at least 1280 × 1024 dots/65536 colors (high color, 16 bit) |
| other | CD-ROM drive (required for software installation) DVD-ROM drive (required for installing calibration data) A combined drive capable of reading CD-R and DVD-R media can be used instead of the two aforementioned drives. ) USB port: USB version 2.0, A-type interface; Used for connecting measuring instruments Excel ® 2003 (required for continuous operation using automatic operation) |
- Windows ®, Excel ® It is a registered trademark or trademark of Microsoft Corporation in the United States and other countries.
- Pentium ® It is a registered trademark or trademark of Intel Corporation in the United States and other countries.