-
Phone
18049952031/18017806506
-
Address
3rd Floor, Building 79, Lane 4855 Guangfulin Road, Songjiang District, Shanghai (Daye Territory)
Product Categories
- Dissolved oxygen analyzer
- Portable Turbidimeter
- Personal sound exposure meter
- COD analyzer
- Dust air sampler
- PH/ORP analyzer
- Multi parameter measuring instrument
- acoustic calibrator
- BOD analyzer
- Wind speed tester
- Data Recorder
- Dangerous gas detector
- Single parameter ion analyzer
- Temperature and humidity detector
- Real time measurement system
- Coating thickness gauge
- Conductivity/TDS tester
- Carbon monoxide detector
- Four in one gas detector
- Ordinary sound level meter
- noise spectrum analyzer
- infrared thermometer
- Oxygen detector
- Integral statistical analyzer
- Photometer/colorimeter
- Vibration instrument
- Ammonia gas detector
- other
Shanghai Bangwo Instrument Equipment Co., Ltd

Aihua AWA6291 Signal Analyzer (Mechanical Vibration)
NegotiableUpdate on 03/02
- Model
- Nature of the Manufacturer
- Producers
- Product Category
- Place of Origin
Overview
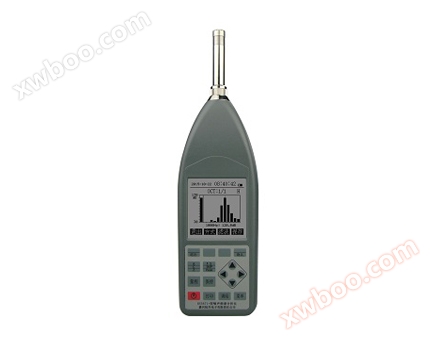
Aihua AWA6291 Signal Analyzer (Mechanical Vibration)
Product Details
The AWA6291 real-time signal analyzer is a pocket sized real-time analyzer for digital signal processing technology, which can perform spectrum and amplitude analysis on noise, vibration, or other electrical signals. Modular design allows users to choose different software to achieve different functions and obtain different measurement indicators. This instrument can be applied in industrial enterprises, environmental protection, labor hygiene, scientific research and teaching, measurement and testing, and other fields to complete the measurement and analysis of machine and equipment noise, environmental noise measurement, sound power level measurement, building acoustics measurement, and measurement and analysis of machine vibration.
technical indicators
|
signal input |
Socket: X9-6z, optional LEMO socket; Input impedance: 150k Ω//100pF; maximum input voltage: 10V (effective value) |
| frequency range |
10Hz~20kHz(±0.2dB); 1Hz~23kHz(±1.0dB) |
|
Range gain |
-10dB、0dB、10dB、20dB、30dB、40dB |
|
Self generated noise voltage |
Less than 4 μ V (1Hz~23kHz) |
|
Voltage measurement range |
15 μ V~10V (effective value) |
|
signal output |
Socket: Φ 3.5 stereo headphone socket; Output impedance: 1k Ω; maximum output signal voltage: 3.2V |
|
Linear range |
Greater than 90dB |
|
A/D bits |
24 digits |
|
sampling frequency |
48kHz |
|
monitor |
240 × 160 dot matrix LCD with EL backlight |
|
output interface |
RS232 interface, can be connected to a micro printer to print measurement results, and can also be connected to a PC to send measurement results and real-time analysis results. USB interface, mini B type, compliant with USB1.1, compatible with USB2.0, can be connected to a PC |
|
data store |
The measurement results are saved in 48Mbit FLASH or the data can be transferred to a USB drive |
|
Internal calendar clock |
Error less than 1 minute/month |
|
working power supply |
6 LR6 alkaline batteries or rechargeable batteries, can also be powered by an 8V external power source |
|
Overall dimensions |
210×90×38(mm) |
|
quality |
0.5kg |
|
Electromagnetic Compatibility |
Meet the requirements of IEC 61672.1:2002 standard for Class X sound level meters |
|
working environment |
Working temperature: -10 ℃ to+50 ℃; Relative humidity: 25% to 90%; Atmospheric pressure: 65kPa~108kPa |
Performance indicators of noise statistical analysis module:
|
Main functions |
Noise statistical analysis, 24-hour automatic monitoring, and integrated measurement |
|
Main measurement indicators |
Statistical Analysis Menu: LAFp、LAfmax、LAF5、LAF10、LAF50、LAF90、LAF95、LAFmin、SD、LAeq1s、LAeq,T、LAE、LAFeqT24-hour measurement menu: In addition to all measurement indicators in the statistical analysis menu, there is also Ld、Ln、Ldn |
|
display resolution |
0.1dB |
|
data store |
Can store statistical analysis results, 24-hour measurement results, and integrated measurement results, up to 12288 sets, and can also transfer measurement results to a USB flash drive |
Noise 1/1 OCT analysis module performance indicators:
|
Main functions |
Real time octave frequency spectrum analysis and integral measurement of noise |
|
Filter type |
Parallel (real-time) octave band digital filter |
|
Filter center frequency |
16Hz~16kHz |
|
The filter meets the standard |
GB/T3241 and IEC61260 Level 1 |
|
Main measurement interface |
List interface, graphical interface. It can display the sound pressure levels of 11 center frequencies and the weighted sound pressure levels of A, C, and Z simultaneously |
|
Main measurement indicators |
Instantaneous sound pressure level in frequency band (Lfmi)Frequency band 1-second equivalent sound level (L)fmeq,1s)Frequency band equivalent continuous sound level (L)fmeq,T)Maximum weighted sound level within 1 second (L)xyp)Instantaneous weighted sound level (Lxyi)1 second equivalent weighted sound level (L)xeq,1s)Equivalent continuous weighted sound level (L)xeq,T)Sound Exposure Level (LAE), Sound Exposure Level (E), Peak C-Level (C)peak)Measure the time elapsed (Tm). (fm is determined by the center frequency, X is the frequency weighting A, C, Z; Y represents time weighting F, S, I) |
|
Real time analysis speed |
Approximately 47 times per second, simultaneously completing all center frequency and A weighting, C weighting, Z weighting measurements |
|
Recording function |
The frequency spectrum of the octave band can be recorded over time at intervals of 31ms, 0.1s, 0.5s, and 1s |
|
data store |
It can store the instantaneous value, 1-second integral value, integral value, maximum value, and total value analysis of octave band analysis, up to 12288 sets of integral measurement results, and can also transfer the measurement results to a USB flash drive |
Noise 1/3 OCT analysis module performance indicators:
|
Main functions |
Real time 1/3 octave frequency spectrum analysis and integral measurement of noise |
|
Filter type |
Parallel (real-time) 1/3 octave band digital filter |
|
Filter center frequency |
12.5 Hz~20 kHz |
|
meet the standard |
GB/T3241 and IEC61260 Level 1 |
|
Main measurement interface |
List interface and graphical interface, capable of simultaneously displaying the frequency band sound pressure levels of 34 center frequencies, as well as the synthesized A, C, and Z weighted sound pressure levels |
|
Main measurement indicators |
Instantaneous sound pressure level in frequency band (Lfmi)Frequency band 1-second equivalent sound level (L)fmeq,1s)Frequency band equivalent continuous sound level (L)fmeq,T)Maximum weighted sound level within 1 second (L)xyp)Instantaneous weighted sound level (Lxyi)1 second equivalent weighted sound level (L)xeq,1s)Equivalent continuous weighted sound level (L)xeq,T)Sound Exposure Level (LAE), Sound Exposure Level (E), Peak C-Level (L)Cpeak)Measurement of Time of Experience (Tm) (fm is determined by the center frequency, X is A, C, Z, W-U; Y is F, S, I) |
|
Recording function |
The frequency spectrum of 1/3 octave band can be recorded over time at intervals of 31ms, 0.1s, 0.5s, and 1s |
|
data store |
Can store 1 second integral value, integral value, and total value analysis integral measurement results for 1/3 octave band analysis, up to 12288 sets, and can also transfer measurement results to a USB flash drive |
Performance indicators of noise FFT analysis module:
|
Main functions |
Real time FFT spectrum analysis of noise |
|
Number of spectral lines |
512 lines, showing 200 spectral lines |
|
sampling frequency |
48kHz、24kHz、12kHz、6kHz、3kHz、1.5kHz |
|
Analyze the upper limit of frequency |
18.75kHz、9375Hz、4687Hz、2344Hz、1172Hz、586Hz |
|
bandwidth |
93.75Hz、46.875Hz、23.438Hz、11.74Hz、5.8594Hz、2.9297Hz |
|
overlap rate |
0%, 50%, 75%, 87.5%, 93.75%, 97% |
|
Average method |
Exponential average F (time constant 125ms) and S (time constant 1s), and linear average |
|
Main measurement indicators |
F-weighted instantaneous value, S-weighted instantaneous value, 1-second equivalent sound level, and equivalent continuous sound level under each spectral line; Maximum weighted sound level within 1 second (L)xyp)Instantaneous weighted sound level (Lxyi)1 second equivalent weighted sound level (L)xeq,1s)Equivalent continuous weighted sound level (L)xeq,T)Sound Exposure Level (LAE), Sound Exposure Level (E), Peak C-Level (C)peak)Measurement of Time of Experience (Tm) |
|
data store |
Capable of storing F-time weighted instantaneous values, S-time weighted instantaneous values, 1-second integral values, and integral values for FFT analysis; The instantaneous values and integral measurement results of the total value analysis can be up to 12288 sets, and the measurement results can also be saved to a USB flash drive |
Vibration 1/3 OCT analysis module performance indicators:
| Main functions | Real time 1/3 octave frequency spectrum analysis and integration measurement of vibration. |
| integrator | Parallel (simultaneous) first-order and second-order integration. Under the spectrum analysis interface, spectrum synthesis is performed; Implemented by digital filtering in the total value analysis interface |
| Detection characteristics | Parallel (simultaneous) effective value, peak value, peak value-peak |
| Effective Value Characteristics | Fast and slow exponential averaging, 1-second linear averaging. Fast gear time constant 1 second, slow gear time constant 8 seconds |
| Filter type | Parallel (real-time) 1/3 octave band, G=2, Digital filter. |
| Filter center frequency | 10Hz、12.5Hz、16Hz、20Hz、25Hz、31.5Hz、40Hz、50Hz、63Hz、80Hz、100Hz、125Hz、160Hz、200Hz、250Hz、315Hz、400Hz、500Hz、630Hz、800Hz、1kHz、1.25kHz、1.6kHz、2kHz、2.5kHz、3.15kHz、4kHz、5kHz、6.3kHz、8kHz、10kHz、12.5kHz、16kHz、20kHz |
| meet the standard | IEC 61260:1995 Class1 |
| Main menu | 1/3 OCT analysis, total value analysis, parameter settings, data management, calibration five submenus |
| Main measurement indicators |
Main measurement indicator: frequency band1Second linear average(afmeq,1sThevfmeq,1sThesfmeq,1s)Linear average of frequency band(afmeq,TThevfmeq,TThesfmeq,T)The effective values, peak values, and peak to peak values of acceleration, velocity, and displacement, as well as the measurement experience time(Tm) |
| integration time |
1 second to24Hours can be set in stages or arbitrarily |
|
data store |
Capable of storing 1/3 octave band analysis1The integration measurement results of second linear average, linear average integral, and total value analysis, up to12288Group, measurement results can also be savedUOn the plate |
|
measurement range(15.92Hz as reference frequency, equipped with 2pC/m/s)2The accelerometer |
Acceleration: 0.05m/s2~5000m/s2 Speed: 0.5mm/s~50000mm/s Displacement: 0.005mm~500mm |
| frequency range |
Acceleration (low frequency band):2 Hz~20 kHz Acceleration (high frequency band): 10 Hz~20 kHz Speed (low frequency band):2 Hz~1.5 kHz speed (high frequency band): 10 Hz~1.5 kHz Displacement (low frequency band):2 Hz~200 Hz displacement (high frequency band): 10 Hz~200 Hz
|
| Basic measurement error |
5%(15.92 Hz as reference frequency) |
Performance indicators of vibration FFT analysis module:
| Main functions |
Real time FFT spectrum analysis and integral measurement of vibration |
| integrator |
Parallel implementation of digital filtering in the total value analysis interface (simultaneously))Acceleration, velocity, displacement |
| Detection characteristics |
Parallel (simultaneously))Effective value, peak value, peak value-peak |
| Effective Value Characteristics |
Average of fast and slow indices,1Second linear average. Fast time constant1Second, slow speed time constant8second |
| FFT analysis line count |
512 lines, visible200Spectral line |
| sampling frequency |
48kHzThe24kHz、12kHz、6kHz、3kHz、1.5kHz |
| Analyze the upper limit of frequency |
18.75kHzThe9375Hz、4687Hz、2344Hz、1172Hz、586Hz |
| Each line bandwidth |
93.75Hz、46.875Hz、23.438Hz、11.74Hz、5.8594Hz、2.9297Hz |
| overlap rate |
0、50%, 75%, 87.5%, 93.75%, 97% |
|
FFT result averaging method |
Exponential and linear. The exponential time constant is divided into two levels, F and S, with the F level having a time constant of 125ms and the S level having a time constant of 1000ms |
|
Linear range |
Above 90dB |
|
data store |
Fast time weighted instantaneous values and slow time weighted instantaneous values that can store FFT analysis1Second integral value, integral value; The instantaneous value and integral measurement results of total value analysis, at most12288The group can also transfer the measurement results toUOn the plate |
|
measurement range(15.92Hz as reference frequency, equipped with 2pC/m/s)2The accelerometer |
Acceleration: 0.05m/s2~5000m/s2 Speed: 0.5mm/s~50000mm/s Displacement: 0.005mm~500mm |
| frequency range |
Acceleration (low frequency band):2 Hz~20 kHz Acceleration (high frequency band): 10 Hz~20 kHz Speed (low frequency band):2 Hz~1.5 kHz speed (high frequency band): 10 Hz~1.5 kHz Displacement (low frequency band):2 Hz~200 Hz displacement (high frequency band): 10 Hz~200 Hz
|
| Basic measurement error |
5%(15.92 Hz as reference frequency) |
Function selection and application
|
configuration |
Configuration Name |
|
Host (mandatory) |
1 set of AWA6291 host (excluding microphone, preamplifier, and authorized software) |
|
Noise measurement optional |
AWA14423 test microphone (including AWA14601 preamplifier+AWA8710-S80 wind bulb) |
|
Statistical analysis software(S6291-00101) |
|
|
1/1 OCT analysis software (S6291-00202) |
|
|
1/3 OCT analysis software (S6291-00303) |
|
| FFT analysis software (S6291-00404) | |
|
Reverberation time measurement software(S6291-00508)(Must first be equipped with noise 1/1 OCT and1/3 OCT) |
|
|
Mechanical vibration measurement selection |
AWA84106 sensor (including AWA14605 preamplifier+1.2-meter sensor cable LZ5-LZ5 connecting wire+magnetic seat) |
| Vibration 1/3 OCT analysis software (S6291-02305) | |
| Vibration FFT analysis software (S6291-02406) | |
| Vibration 1/3 OCT analysis software (S6291-02305)+Vibration FFT analysis software (S6291-02406) | |
| Printer selection |
AWA40-S Mini Printer |
Similar Product Recommend