-
E-mail
rliu_1@sypi.com.cn
- Phone
-
Address
Building 1, Huadian Intelligent Network Industrial Park, No. 28 Siwei Road, Dongli Development Zone, Tianjin
Solution
Tianjin Sanying Precision Instrument Co., Ltd
In order to make the course easy to understand, Huang Chao, the lecturer of "Animal Anatomy and Embryology" at Sichuan Agricultural University, linked the course content with details in daily life and even showed students facial expressions of human cervical vertebrae. Among them are "Surprise of the atlas", "Foolish smile of the axis", "Smile of the fifth cervical vertebra", "Bad smile of the seventh cervical vertebra"
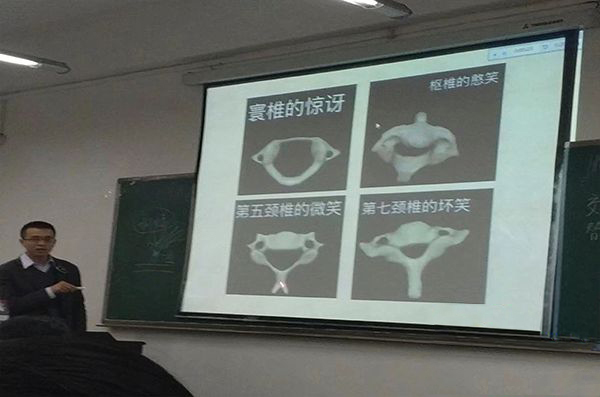
(Image from the internet)
I am curious about what these smiling faces look like in micro CT scans? We selected a section of sheep's spine and placed it in a CT scanner for scanning. Among the hundreds of sliced images obtained, we selected a "cute big smiling face".
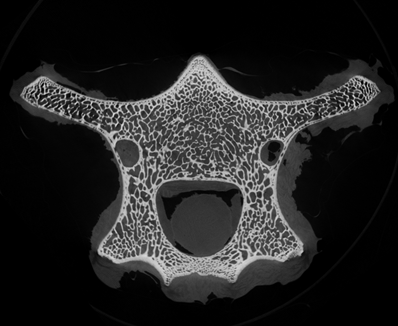
In the study of bones, the application of micro CT is quite common. We choose small-sized CT data to introduce the process of data analysis:
Step 1. Obtain CT three-dimensional volume data
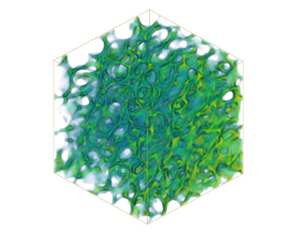
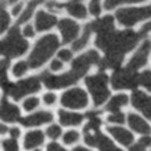
Bone CT slice image
(Local magnification)
Step 2. Binary the image to distinguish between bone tissue and medullary cavity
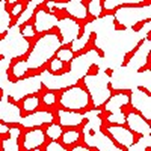
Binary processing of sliced images
Step 3. Calculate bone related parameters
BV:Bone VolumeBone volume refers to the volume of bone tissue defined within the region of interest, typically measured in units ofmm3
TV:Total/Tissue VolumeThe total volume refers to the total volume of the area of interest, usually measured in units ofmm3
BS:Bone SurfaceBone surface area refers to the total surface area of bone tissue, usually measured in units ofmm2
BV/TV:Bone volume fraction can directly reflect changes in bone mass, measured in units of%
BS/BV:The area size of bone tissue per unit volume, expressed in units ofmm-1
BS/TV:It is called bone surface area density and can indirectly reflect the amount of bone mass. The unit ismm-1
Tb. Th:Trabecular ThicknessThe average thickness of bone trabeculae, measured in micrometersmWhen osteoporosis occurs,Tb. ThThe value decreases.
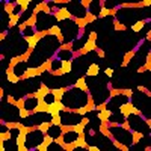
Tb. Sp:Trabecular Separation/SpacingThe average width of the medullary cavity between bone trabeculae, measured in micrometersmWhen osteoporosis occurs,Tb. SpThe numerical value increases.

Width distribution of medullary cavity
DA:Degree of AnisotropyThe degree of anisotropy is used to evaluate the directionality and symmetry of bone trabeculae. In the early stage of osteoporosis, the load-bearing bone trabeculaeDAUsually increases, as osteoporosis worsens,DAIt will decrease.
After software calculation, the bone parameter values for the small-sized bone area we selected are as follows:
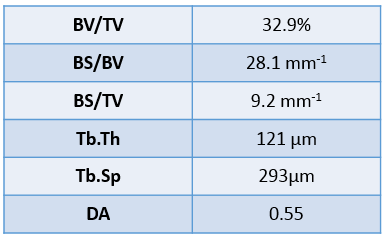
Currently, with the intensification of population aging, osteoporosis and its complications have become major diseases that pose a threat to human health. The mechanism by which osteoporosis leads to a decrease in bone strength is not only due to a decrease in bone mass, but also a combination of microstructural damage to bone trabeculae, changes in cortical bone porosity, and a decrease in total bone mass. Micro CT can not only obtain changes in overall bone mass, but also quantitative indicators of trabecular bone microstructure within the skeleton. By combining trabecular bone microstructure indicators, cortical bone indicators, and bone mass, it can comprehensively evaluate the role of bone strength and bone mass in the occurrence and development of osteoporosis.