-
E-mail
market@ensoultech.com
-
Phone
15611538392
-
Address
401-501, Building 13, Huiying Industrial Park, Intersection of Zhonghuan West Road and Xiwu Road, Tianjin Airport Economic Zone
Tianjin Runze Instrument Co., Ltd
Breaking through the monitoring of black and odorous water bodies: the new application and ecological value of AIRSENSE electronic nose
Date: 2025-10-13Read: 0
Black and odorous water bodies are polluted urban rivers that often appear black and emit a foul odor, which has a negative impact on residents' lives, ecosystem functions, and local economy. Since 1962, they have gradually become a common environmental problem, especially in underdeveloped areas. Traditional black and odorous water monitoring can be divided into two categories: in-situ monitoring requires direct addition of chemical or biological reagents to the water, which is time-consuming and prone to introducing new pollutants; Remote monitoring requires the use of reagents to treat water samples in different locations, making it impossible to obtain real-time water quality parameters on site. Meanwhile, traditional chemical methods for detecting key indicators such as pH, chemical oxygen demand (COD), total nitrogen (TN), and total phosphorus (TP), such as potassium dichromate method for COD and alkaline potassium persulfate digestion UV spectrophotometry method for TN, require chemical reagents and specialized equipment, which are time-consuming, labor-intensive, and costly. Therefore, alternative monitoring technologies are urgently needed.
Research Objective
Using traditional methods to measure water quality parameters such as pH, COD, TN, TP in black and odorous water bodies as a benchmark for comparison.
Analyze the response characteristics of AIRSENSE electronic nose sensor in headspace gas detection of black and odorous water bodies.
Verify the recognition ability of AIRSENSE electronic nose for black and odorous water samples and its predictive effect on water quality parameters.
01
Experimental Design
01
Main instruments and reagents
Experimental instrument: German AIRSENSE electronic nose.

Sampling location: Select a river with a total area of 2.8km ² and a total length of 8.3km as the research object.
Sampling method: Six sampling points (1-6 groups) are set up every 1km along the river, and water samples are collected using 1.5L plastic bottles to ensure compliance with electronic nose detection and routine analysis requirements; After bringing the water sample back to the laboratory, control the temperature at 20 ± 0.5 ℃.
02
Testing Process
Take 10mL of water sample and place it in a 500mL beaker. Seal it with plastic wrap and let it stand for 30 minutes to generate headspace gas; Before testing, make holes in the cling film for stable gas flow. Within 60 seconds after testing, clean the gas path and sensor room with clean air; The headspace gas flow rate is set to 200mL/min, with a signal collected once per second and a detection time of 75s to ensure signal stability; Prepare 27 samples at each sampling point, and represent the electronic nose signal in G/G ₀ (G is the resistance of the sensor in the headspace gas of the sample, and G ₀ is the resistance in clean air).
02
Data analysis methods and tools
Linear Discriminant Analysis (LDA): A linear equation was constructed using Fisher's linear discriminant analysis, Analysis of Variance (ANOVA), and regression analysis to classify and identify six groups of water samples. The data was first normalized to zero mean, and the Wilks' lambda method was used to screen variables (including F=0.05 and excluding F=0.10). One fold cross validation was used to avoid over optimization of the data.
Partial Least Squares Regression (PLSR): To address the issue of multicollinearity in sensor signals, a regression model was constructed between electronic nose signals (X matrix) and water quality parameters (Y matrix). 162 samples were divided into 120 training samples and 42 test samples, and the accuracy of the model was evaluated using the coefficient of determination (R ²) and root mean square error (RMSE).
ANOVA Partial Least Squares Regression (ANOVA-PLSR): Decompose the total variance of the data to extract different effects, analyze the correlation between electronic nose signals and water quality parameters, and determine the significance of variable relationships (p<0.05) by cross validation and Jack knifing method of stability plot to analyze regression coefficients.
Tool software: Perform LDA analysis using SPSS 16.0, process PLSR using MATLAB 2012a, complete ANOVA-PLSR using Unscrambler 10.3, and obtain data profiles such as mean, standard deviation, and correlation through descriptive statistical analysis.
03
Results and Discussion
Characteristics of water quality parameters measured by traditional methods
Parameter range: The pH of 6 sampling points is 7.2-7.5, with no significant difference; The COD is 50-115mg/L, with significant differences at each point, reflecting different levels of pollution (the river has no industrial wastewater, and the pollution mainly comes from residential activities); TN is 20-30mg/L, with differences between sites; TP was 1.34-2.13mg/L, with no significant point difference.
Correlation: Pearson correlation matrix analysis shows that the correlation between pH, COD, TN, and TP is extremely low, and there is no obvious distribution pattern of water sample data along the sampling section of Moon River, indicating that there is no specific pattern of pollution level in this area, and multiple dynamic monitoring points are needed for black and odorous water quality.
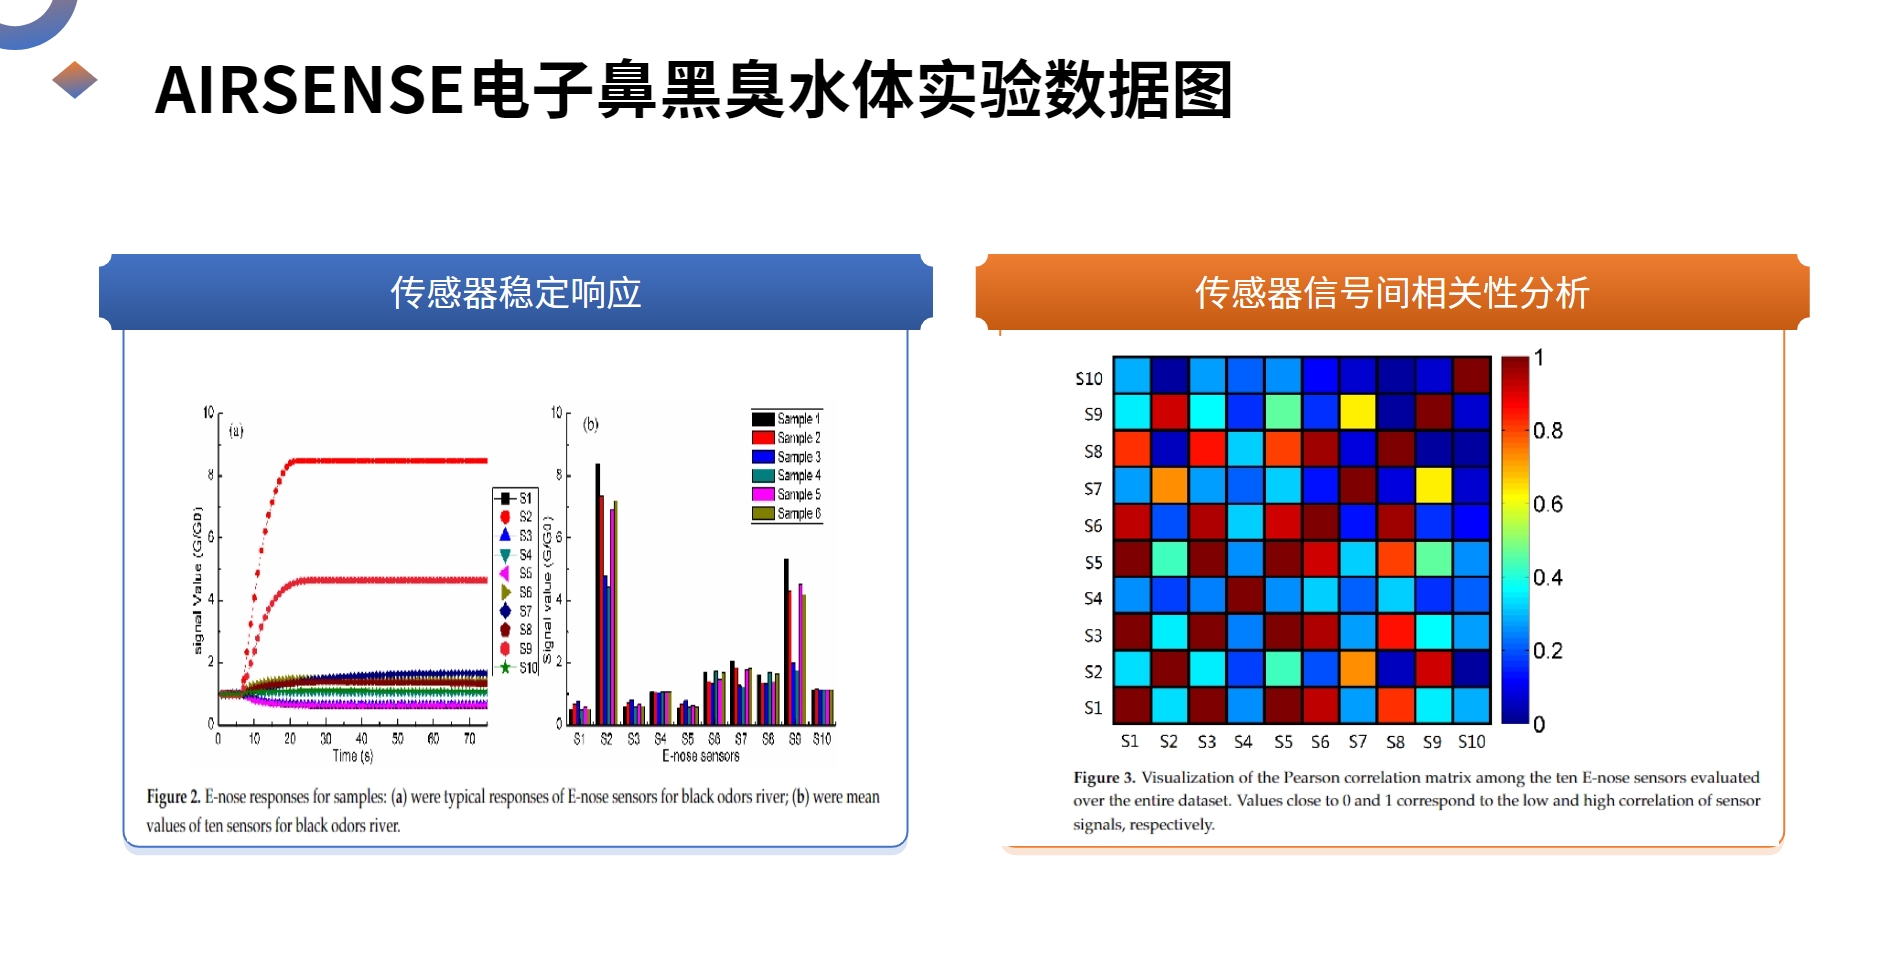
Response characteristics of AIRSENSE electronic nose sensor
Signal stabilization time: All 10 sensors reached dynamic equilibrium after 20 seconds of detection, indicating that the electronic nose can complete the detection of black and odorous water samples within 30 seconds. To ensure signal stability, the signal from the 70th second was ultimately selected for analysis.
Sensor sensitivity: Sensors S2 and S9 are most sensitive to headspace gas in black and odorous water bodies, while S1, S3, S5, S6, and S7 have certain sensitivity. S4 and S10 have almost no response throughout the entire detection process.
Signal multicollinearity: Pearson correlation matrix analysis found that sensor signals have high multicollinearity (S4, S10 have low correlation with other sensors), which can interfere with regression analysis. Therefore, PLSR is used to reduce the impact of multicollinearity.

The recognition and parameter prediction effect of electronic nose on water samples
Qualitative Identification (LDA): Input the 10 sensor signals from the 70th second into the LDA model, filter them using the Wilks' lambda method, retain the 10 variables, and generate 5 discriminant functions. The first two discriminant functions explained 62.9% and 27.2% of the total variance, while the third explained 6.4%. The six water samples were distributed clearly and without overlap in the discriminant space. The correct classification rates of the original grouped samples and cross validation samples were both 100%, proving that the electronic nose can accurately identify black and odorous water samples at different locations.
Parameter Prediction (PLSR): The PLSR model has excellent predictive performance for pH, COD, TN, and TP, with R ² values greater than 0.90 for both the training and testing setsThe specific data is shown in the table below, and the actual values are closely distributed with the predicted values, indicating that the electronic nose can effectively predict key water quality parameters of black and odorous water bodies through headspace gas detection.
Signal and Parameter Correlation (ANOVA-PLSR)The ANOVA-PLSR model explains 98% of the variance of the X matrix (electronic nose signal) and 94% of the variance of the Y matrix (water quality parameters) under two principal components. Sensors S2 and S9 show a significant positive correlation with COD, while other sensors also have varying degrees of correlation with water quality parameters. Due to the cross sensitivity of electronic nose sensors to substances in headspace gas, they can capture signal characteristics related to water quality parameters.
04
Conclusions and Prospects
The pH, COD, TN, and TP of the black and odorous water in the river have no significant correlation through traditional detection, and the sampling data is irregular and needs to be dynamically monitored.
The electronic nose sensor signal exhibits multicollinearity, but ANOVA-PLSR confirms that it can capture water quality parameter related information through cross sensitivity.
The combination of electronic nose and LDA can accurately identify black and odorous water samples at different locations with 100% accuracy. Combined with PLSR, it can efficiently predict pH, COD, TN, and TP (R ²>0.90), making it a fast, low-cost, and easy to operate black and odorous water monitoring technology.