-
E-mail
lei@guiyisci.com
-
Phone
13651923355
-
Address
Room 502, No. 25, Lane 1288, Luoning Road, Baoshan District, Shanghai
Shanghai Siyi Biochemical Technology Co., Ltd
Empower Software Usage Tips (29): How to Calculate Peak Valley Ratio
Date: 2025-10-22Read: 0
When the separation effect of multiple peaks is poor, the software cannot determine the true value of the half peak width. At this time, there will be integration results of shared peak valley points between chromatographic peaks, and the peak "integration type" is "BV", "VV" or "VB", as shown in Figure 1 for "Peak 1", "Peak 2" and "Peak 3". The ratio of peak height to peak valley point can be used as an indicator of "system adaptability", which is clearly stated in the 2025 edition of the Chinese Pharmacopoeia.
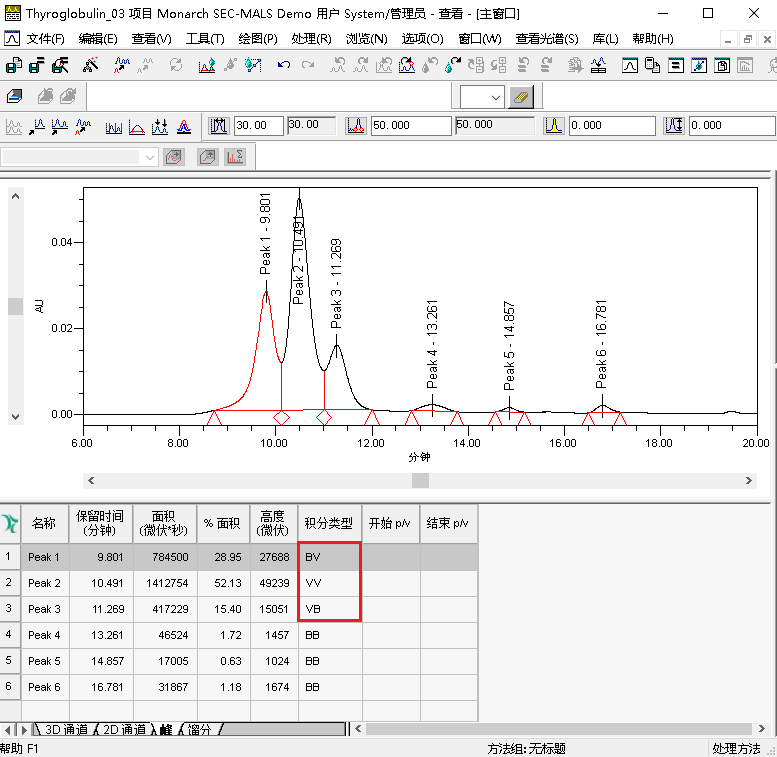
Figure 1. Separation spectrum.
Steps for calculating peak to valley ratio
1.
Enable "System Adaptability" in the "Processing Method" and enter "Empty Volume Time", as shown in Figure 2.
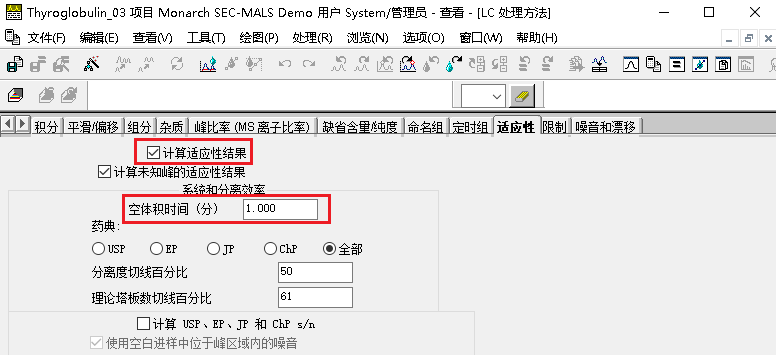
Figure 2. Processing method settings.
2.
Integrate the chromatogram again. The calculation results are shown in Figure 3, where the peak to valley ratio is calculated using two fields: "Start p/v" and "End p/v.
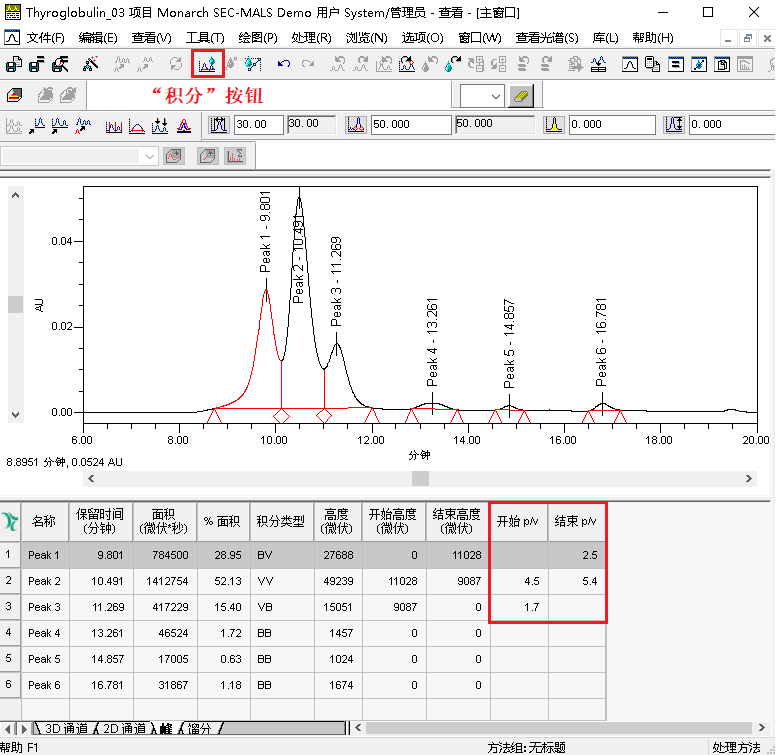
Figure 3. Integral results.
Note:
Start p/v ": the ratio of peak height to peak starting point height. If the starting point of the peak falls on the baseline instead of the peak valley point shared with other peaks, this field will not be calculated, as shown in the calculation result of 'Peak 1'.
End p/v ": the ratio of peak height to peak end point height. If the end point of the peak falls on the baseline instead of the peak valley point shared with other peaks, this field will not be calculated, as shown in the calculation result of 'Peak 3'.