-
E-mail
qeservice@enli.com.tw
-
Phone
18512186724
-
Address
Room 409, Building A, No. 169 Shengxia Road, Pudong New Area, Shanghai
Guangyan Technology Co., Ltd
QFLS imaging shows PDAI homogenization breaking through 33.1% PCE
Date: 2025-12-01Read: 1
Research background and challenges: High performance textured perovskite/The technical bottleneck of silicon stacked solar cells
1. The gap between technological potential and industrial practice
perovskite/Silicon stacked solar cells can be utilizedMature crystalline silicon production lineAnd achieveHigh power conversion efficiency(PCE)And become the focus of attention in both academia and industry. in recent yearsPCEThe breakthroughs mainly come from: optimization of light management technology, improvement of perovskite crystal quality and defect passivation, development of hole selective self-assembly monolayers, and perovskite/Electronic transport layer(C60)Interface passivation strategyThe progress.
However, existing efficient passivation strategies are mostly applied toSolution process of flat substrateOften, it is necessary to perform tests on silicon-based batteriesCustomized processing(such as additional polishing or adjusting pyramid size). This is related toIndustrial standard silicon technologyRandom pyramid morphology (height) adopted> 1 μmThere is an inherent conflict in the thickness of perovskite, which makes it difficult to integrate efficient strategiesTextured silicon substrate.
2. The core challenge of textured stacked batteries
Based on large-sized textured siliconTextured perovskite/Silicon stacked batteryAlthough possessingManufacturing cost advantageandExcellent light management effectHowever, in implementing effective perovskite/C60There are key technical obstacles in interface passivation, leading to differences compared to planar devicesOpen circuit voltage(VOC)Losses exceeding100 mV.
3. Electrical mechanism of performance loss
In depth analysis shows that the performance degradation of textured stacked batteries is due to the following electrical issues:
Band mismatch effect: The interaction between perovskite and electron transport layerLarge conduction band offset(ΔEC,ETL)Causing severe imbalance of carrier concentration at the top contact pointAnd this effect extends to the entire volume of perovskite
Interface composite loss: Imbalance of carrier concentration causedHigh interface recombination rateDirectly leading to VOCsignificant decline
Transmission performance degradation: The concentration of charge carriers in the absorption layer is limitedInternal conductivityCausing serious carrier transport and selectivity loss, manifested asFill factor(FF)Poor performance
Research Team and Main Achievements
This study was conducted byFraunhofer Institute for Solar Energy Systems, Germany(Fraunhofer ISEofOussama Er-rajiProfessor andStefan W. Glunz教授And King Abdullah University of Science and Technology(KAUSTofStefaan De WolfCo led by professors, research results published in international journals ScienceThe research team has successfully proposed a groundbreaking interface engineering strategy, significantly improving the industrial standard for textured perovskite/The performance and stability of silicon stacked solar cells.
Main research strategies
Hybrid two-step perovskite deposition method: Compatible with industrial standard textured silicon substrates
PDAISurface treatment technology: introduce1,3-Surface treatment of perovskite with diaminopropane dihydroiodide to reduce the interaction between perovskite and electron transport layer(C60)The conduction band shift between and induces electron accumulation throughout the perovskite absorption layer
Research achievements and technological highlights
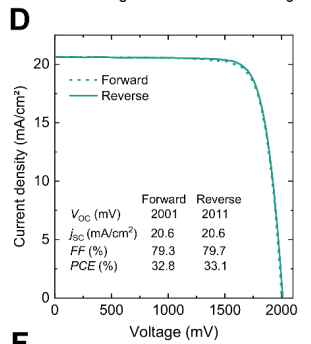
Fig.4D
Core Innovation: Deep Field Effect Passivation Mechanism of Electronic Accumulation
Breaking through the limitation of traditional interface passivation that only suppresses interface recombination,PDAIInducing significant electron accumulation within the entire perovskite absorption layer
Successfully reduced perovskite/C60Interface conduction band offset(ΔEC,ETL)Reduce interface composite losses
Significantly improve the conductivity of the perovskite absorption layer, significantly reduce carrier transport losses, and enhance the filling factor performance
Breakthrough in Device Performance Milestones
Power conversion efficiency(PCE)reach 33.1%Create a new high in textured stacked batteries
Open circuit voltage(VOC)Gundam 2.01 VEliminating the textured devices of the past>100 mVThe performance gap
Fill factor(FF)Significantly improved, confirming the effectiveness of the strategy to reduce transmission loss
Industrial compatible architecture performance is comparable to current record keeping devices
Excellent stability and industrial application potential
obtainCertified31.6%stablePCEShow practical application value
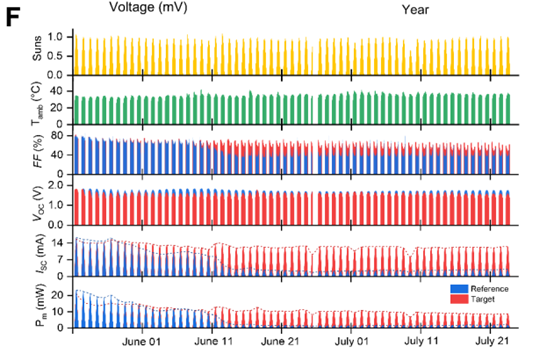
PDAIBy suppressing ion migration, the long-term operational stability of the device is significantly enhanced
Excellent performance in hot and humid outdoor environments and wet and hot tests along the Red Sea coastFFandVOCHas good resistance to losses
The strategy demonstrates reproducibility among different research institutions, proving the feasibility of industrialization
Experimental steps and process flow
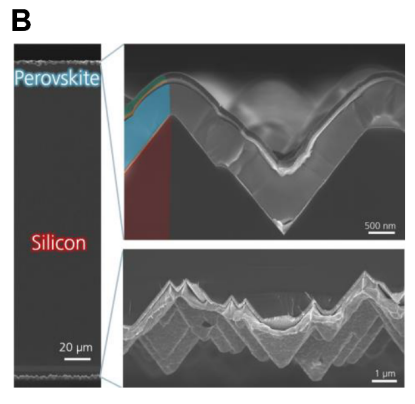
Fig.4B
1. Preparation of textured silicon bottom battery
adopt250 μmthickpFloating area silicon wafer (resistivity)1 cm), 利用KOHIndustrial standard double-sided random pyramid texture is applied to the solution to form1-4 μmHigh pyramid structure. After ozone wet chemical cleaningPECVDTechnology in double-sided deposition intrinsic/Doping amorphous silicon passivation layer(~27 nm)And sputter on the front and back respectivelyITOReorganization layer(20 nm)With the completeITO/AgElectrode structure. Finally, the wafer will be laser engraved into2.2×2.2 cm²or2.5×2.5 cm²Substrate, reserved1×1 cm² ITOThe solder pad serves as the active area.
2. Hybrid deposition technology for perovskite top cells
Silicon substrate cleaned with ethanolUV/After ozone treatment, spin coating deposition is performed firstMe - 4PACzHole transport layer. The perovskite absorption layer adoptsInnovative hybrid two-step evaporation/Spin coating methodPreparation:((1)Co evaporationPbI₂/CsXInorganic skeleton(~550 nm), (II)Dynamic spin coatingFAI/FABrOrganic halide solution (containing a small amount of urea crystallization agent), and adjustedFABr/FAIProportional control target bandgap(1.67 or1.70 eV). After completion, in the air100°Cannealing 10 minute.
3. PDAIImplementation of interface passivation strategy
After the formation of the perovskite layer, introduceCore innovative technologies-1,3-Diaminopropane Dihydroiodide(PDAI)Surface treatment.PDAIDissolved in chlorobenzene/In isopropanol mixed solvents, it can pass throughSpin coating or dip coatingDeposition method (immersion coating method shows good scalability), followed by100°Cannealing 3 Minutes to achieve perovskite/C60Deep field effect passivation of the interface.
4. Electrode and Optical Layer Construction
completePDAIAfter processing, vacuum evaporate in sequenceC60Electronic transport layer(18 nm),ALDdepositionSnOₓ Buffer layer(15-30 nm,80°C)Shielding sputtering top transparent conductive oxide(ITOorINFORMATION), evaporationAgTop electrode(650 nm)Finally, the heat evaporatesMgFₓ Anti reflection layer(140 nm). All evaporation processes are accurately monitored by a quartz crystal microbalance.
5. Stability assessment and packaging
To evaluate long-term stability, adoptPVConnect the battery with silver paste and perform industrial grade packaging. The packaging structure includes solar glassTPUEncapsulating agent andGDPEdge sealant, overall in vacuum laminating machine120°Chandle 20 Minutes to ensure excellent environmental protection performance.
Research results and characterization
Quasi Fermi level splitting(QFLS)Image analysis
QFLSUsed to quantify the open circuit voltage of materials(VOC)Potential to help researchers understand the sources of non radiative composite losses and evaluate the impact of different processes on material properties, providing evidence for interface engineering and material optimization.
Quasi Fermi level splitting of reference perovskite thin films(iVOC)The spatial fluctuation of image display is significant, with standard deviation(σ)for38 mVThe average value is1.23 VAfter PDAIAfter processing,iVOCThe spatial uniformity is significantly improved,σreduce to26 mVOn averageiVOCincreased20 mVreach, achieve, attain1.25 VThis indicates thatPDAIHas slight chemical passivation properties. In sedimentationC60Afterwards, the reference stackiVOCdecline80 mVto1.15 VAnd it has a wider distribution(σ = 65 mV)But PDAIPassivation stackiVOCmaintain at1.23 VThe distribution is also narrower(σ = 17 mV).
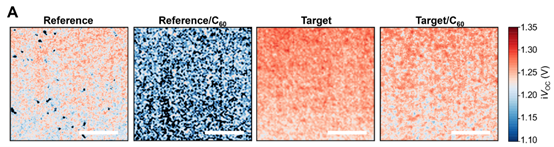
Fig. 3ADisplayed references andPDAIProcessed perovskite thin filmiVOCImage.
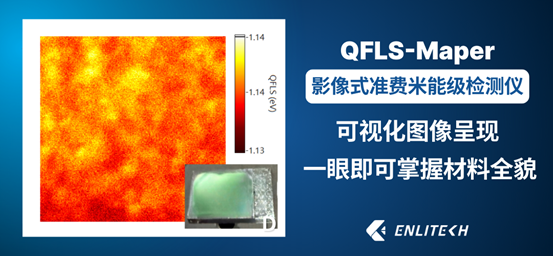
In order to accurately grasp the materialsQFLSCharacteristics and rapid assessment of their potential,EnlitechofQFLS-MaperThe quasi Fermi level splitting detection instrument is an ideal choiceIt can move at an extremely fast speed(QFLSImage not available 3 In seconds,Pseudo J-VCurve not reached 2 Provide intuitive (in minutes)QFLSVisualize images and measure themiVOCThePseudo J-VThePLQYandEL-EQEWaiting for key parameters. This not only helps researchers quickly predict material efficiency limits, but also allows for a visual representation of material quality and quasi Fermi level distribution, greatly improving research and development efficiency.
J-VCurve measurement
Used to directly evaluate the key performance parameters of solar cells. fakeJ-V (pseudo-J-V)The curve is used to quantify the series resistance of the device(RS)And transmission loss.
throughPDAIStrategy, Device PCEfrom29.1%upgrade to32.3%Among them VOCfrom1.83 Vincrease to1.94 V,FFfrom79.4%upgrade to81.6%The recording device has reached a higher level 33.1%ofPCEand2.01 VofVOC.
fakeJ-VMeasurement shows that,PDAIAfter processing, pseudo fill factor(pFF)Compared to realityFFDifferences from reference devices6%Significantly decreased to3%At the same time,power point(MPP)The series resistor(RS)Also from 6 Om-Reduce the square centimeter to 3 Om-Square centimetersThis indicates thatPDAIMainly by regulating the carrier density, it reducesRSThe non Aum contribution reduces transmission loss.

Fig. 4D Showcased the stacked solar cellsJ-VThe curve, itsPCEreach, achieve, attain33.1%,VOCfor2.01 VThis demonstrates the breakthrough in performance of our research strategy.
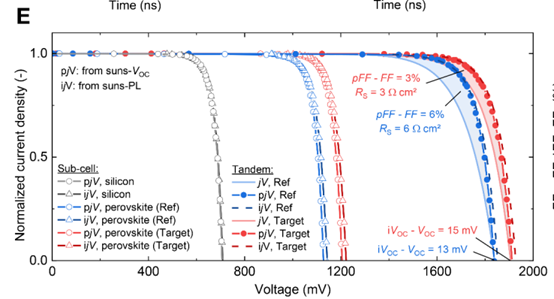
Fig. 3E Described references andPDAIPassivation of stacked solar cellsJ-VFakeJ-VAnd deductionJ-VCurve, visually displayedPDAIHow did it shrinkpFFandFFThe gap between them proves their effectiveness in reducing transmission losses.
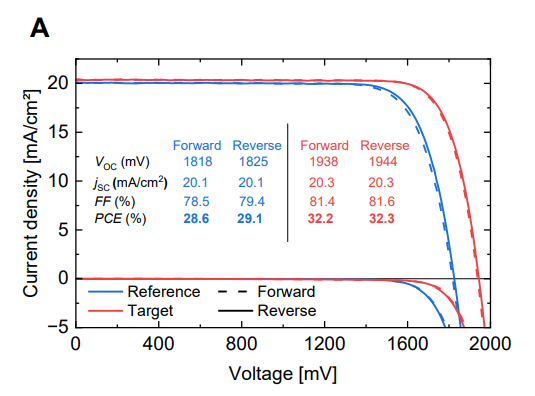
Fig. S17A Further provided arePDAIProcessing and nonePDAIProcessing devices under forward and reverse scanningJ-VThe curve and its detailed photovoltaic parameters clearly displayPDAIInVOCTheFFandPCEUpward improvement.

Perform preciseJ-VCurve measurement, especially for new generation solar cells such as perovskite/Silicon stacked battery,Enlitechof SS-X AM1.5GStandard Spectral Solar Simulator can provideA+High spectral accuracy and excellent stability. Paired with it IVS-KA6000Comprehensive testing softwareNot only can it execute in a positive direction/reverseIVScanning and multi-channel testing, more capableNRELAsymptotic detection function.SS-XcombineSS-IRISTechnology that can automatically adjust light intensity without changing the spectrum, supportingSun-VocWaiting for complex tests.
EQEmeasurement
Measurement is used to determine the current collection efficiency of solar cells under different wavelengths of light and evaluate the current matching between each sub cell of the stacked cell.
PDAIAfter processing, the device's Short circuit current density(JSC)remain unchangedThis result is related toEQEConsistent with the reflectance measurement results. The research team also explored the bandgap of perovskite by1.67 eVadjust to1.70 eVTo achieve better current matching, which further enhances device performance.EQEThe stability of the curve indirectly proves that the long-term stability of the device is not affected.

Fig. S17B Presented references andPDAIProcessing devicesEQEThe measurement results show that the spectral response curves of the two are similar, supportingJSCMaintain consistent observation.
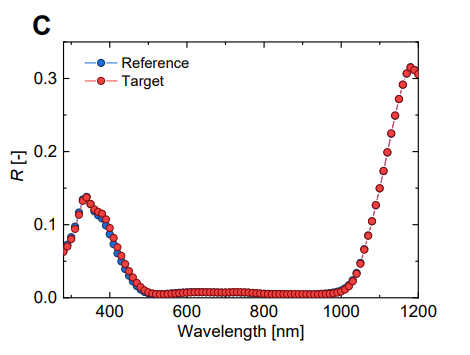
Fig. S17C The corresponding reflectance measurement results were displayed, further verifying the comparability in optical management.
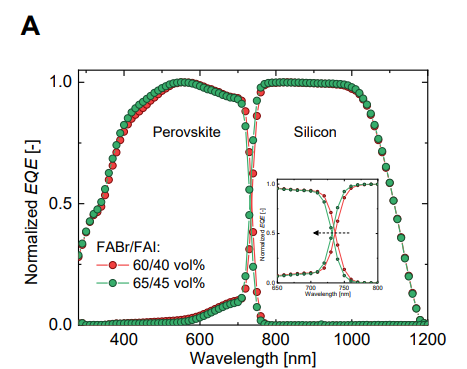
Fig. S23A It displays different band gaps(1.67 eVand1.70 eV)The device'sEQEMeasurement emphasized how bandgap adjustment affects the spectral absorption edge of perovskite sub cells to achieve current matching.

Enlitechof QE-RQuantum efficiency measurement system It is a reliable tool in photovoltaic research, widely used in over fields due to its repeatability and accuracy 500 A photovoltaic research laboratory and has been established1,000Multiple articlesSCIPaper citations, including flagship journals such as Nature and Science.QE-RThe system is specially designed with dual independent lock-in amplifiers, which can accurately measure the quantum efficiency of multi junction solar cells, including perovskite/Crystalline silicon stacked solar cells. It providesEQETheIPCETheSRTheIQEIt can provide various data such as reflectivity and perform current integration calculations.
UPSandAM-KPFMmeasurement
Ultraviolet photoelectron spectroscopy(UPS)Used for analyzing the work function of thin films(Wf)And ionization potential(IP)To study perovskite/C60Alignment of interface bands. Amplitude modulated Kelvin probe force microscope(AM-KPFM)It is used to verify the change in work function and observe the uniformity of surface potential distribution.
UPSMeasurement shows that,PDAIWork function of passivated perovskite thin film(Wf)Increased compared to the reference sample270 meV(from4.49 eVIncrease to4.76 eV)Ionizing potential(IP)The change indicates the formation of dipoles. This dipole formation leads toC60Band offset at the interface from the reference sample180 meVMinimize to70 meV.AM-KPFMThe results also showed thatPDAIThe surface potential distribution after treatment is more uniform.

Fig. 2A Presented references andPDAIProcessing the secondary electron cutoff region of thin filmsUPSMeasurement results.

Fig. 2C Displayed references andPDAIProcessing thin films andC60The ability to bring pictures.

Fig. S9G Then throughAM-KPFMThe measurement results show the reference andPDAIProcessing the work function distribution of thin films.
DFTcalculate
Calculation is used to gain a deeper understanding from a theoretical perspectivePDAIThe mechanism and direction of dipole formation of molecules on the surface of perovskite.
DFTCalculation revealsPDAIMolecules have 8.27 DThe dipole momentResearch has found that,PDAIOrganic enriched perovskite surface (mixed evaporation used in this study)/When the surface generated by the spin coating method interacts with each other, it willInducing a directionC60The positive dipoleThis leads to an increase in the work function. This is consistent with the observed trend of increasing work function in the experiment.
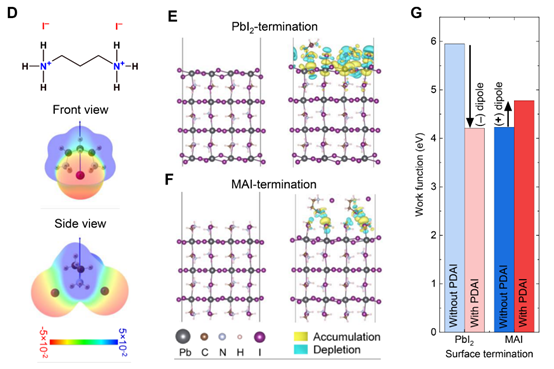
Fig. 2D displayedPDAIThe chemical structure and electrostatic potential diagram of molecules.
Fig. 2F displayedPDAIOrganic terminalMAPbI3The optimized structure after interaction and the difference in induced charge density.
Fig. 2G presentedPbI2-Terminal andMAI-terminalMAPbI3Whether or not there isPDAICalculate the work function in the given situation.
Time analysisPL (TRPL)Transient absorption spectroscopy(TA)
Time resolved photoluminescence(TRPL)Measure the competitive process used to decouple interface charge transfer and interface charge recombination. transient absorption(TA)Spectroscopy is used for detailed study of carrier dynamics and non emission trap state signals at the nanosecond time scale.
withC60The differential lifetime of the reference sample is~1 μsReached the platform period, compared to noneC60The reference sample has decreased by an order of magnitude, indicating that interfacial recombination dominates the dynamics. By contrast,sutraPDAIProcessing and withC60The stack displays a differential lifetime platform period of approximately~10 μsAnd noneC60When is~13 μsThis strongly indicates thatThe interface composition in the target stack is significantly reduced.TAThe measurement results further indicate that the long-life shallow trap carrier signals present in the reference sample arePDAIDisappeared after processing.PDAIProcessing makes reference/C60Stack ofTABandgap bleaching weighted average carrier lifetime from27 nsincrease to53 ns, confirmVOCThe main reason for the improvement is the reduction of interface recombination.
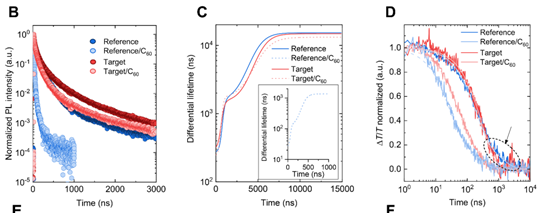
Fig. 3B Displayed references andPDAITime analysis of processing thin filmsPLAttenuation curve.
Fig. 3D Presented reference and reference in transient absorption measurementPDAIProcess the bandgap bleaching attenuation curve of the film.
Suns-VOCmeasurement
Under open circuit conditions to avoid charge extraction and obtain pseudoJ-VThe curve is considered to have no transmission loss and can be used to quantify the total series resistance(RS).
The measurement results found that although the pseudo fill factor(pFF)maintain at85%Unchanged, but pFF-FFThe difference lies inPDAIPassivation devices from reference devices6%reduce to3%Therefore, at the power point(MPP)The series resistor(RS)The calculated value has significantly decreased,from 6 Om-Square centimeters reduced to 3 Om-Square centimetersEvaluate under different operating voltagesRSThe target device displays a smaller slope, emphasizingPDAIMainly by adjusting the carrier density, it reducesRSThe non Aum contribution.

Fig. 3E Displayed references andPDAIPassivation of stacked solar cellsJ-VFakeJ-VAnd deductionJ-VCurve.

Fig. S14 Described references andPDAIProcessing devices under different operating voltagesRSCurve.
Bias assisted charge extractionBACEmeasurement
Quantifying the concentration of mobile ions in solar cells is crucial for understanding the long-term operational stability of perovskite devices.
After stability testing,Reference device's mobile ion concentration(6.5 × 10^17 cm⁻³)It is the target device(2.6 × 10^17 cm⁻³)Nearly three timesThis may be a clear reason for the accelerated degradation of reference devices. The results show that afterPDAIModified perovskite/C60The interface can effectively fix ion migration, thereby enhancing the operational stability of the device.

Fig. S26A, B Presented representative reference solar cells andPDAIPassivation of solar cells before and after stability testingBACEMeasurement results.
Other characterizations
Outdoor stability and humidity testing Verify the long-term reliability of the device in actual operating environments.PDAIPassivation devices demonstrate stability in outdoor environments along the Red Sea coast during wet heat testingPCEThe retention rate relative to the initial performance73.7%upgrade to83.4%Significantly improvedFFandVOCAnti attenuation ability.(Fig. 4F, Fig. S27)

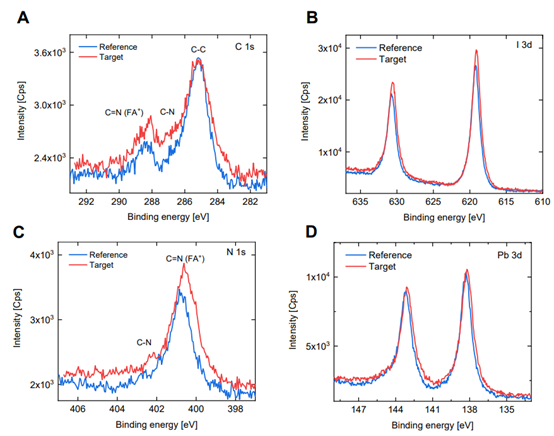
XX-ray photoelectron spectroscopy(XPS) confirmPDAIThe successful adsorption and chemical interaction of molecules on the surface of perovskite. DetectedPDAIMolecular characteristic signals,C-NKey signal enhancement,N 1sThePb 3dandI 3dCore energy level shifts towards lower binding energy, confirmingPDAIEffective interaction occurs with the surface of perovskite.(Fig. S5A-D)
Structural characterization(XRD, GIWAXS, STEM) verifyPDAIThe processing does not affect the integrity of the perovskite crystal structure. Confirm that no low dimensional perovskite phase has formed in the system,3DThe perovskite structure remains unchanged at the interface,PDAIThe treatment has no significant effect on the morphology of perovskite.(Fig. S6A-G, Fig. S7C-E)


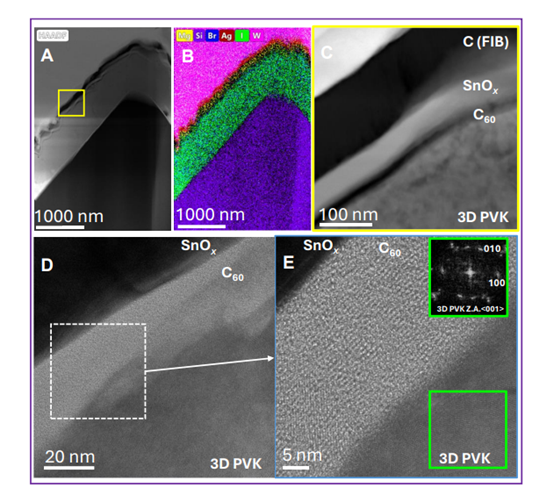
Scanning electron microscope(SEM) Observe the cross-sectional morphology of the device and the surface structure of the perovskite film. Confirm that the structure of each layer is clear,PDAIThe addition did not cause any change in the apparent grain size of perovskite, maintaining good film conformity.(Fig. 4B, Fig. S8A-B)

Terahertz spectroscopy and space charge limited current(SCLC) Measure carrier mobility and defect density to understand the mechanism of conductivity enhancement. Carrier mobility remains at a similar level(16.5-18.5 cm²/Vs)The fundamental reason for the decrease in series resistance is the increase in electron concentration, and the defect density is1.55×10^15drop to1.15×10^15 cm^-3.(Fig. S15, Fig. S16A-B)


Research Conclusion and Results Summary
Successful research and development based on1,3-Diaminopropane Dihydroiodide(PDAI)The passivation strategy significantly improves the industrial standard for textured silicon-based perovskite/Efficiency and stability of silicon stacked solar cells.
Record breaking device performance
Device implementation33.1%The photoelectric conversion efficiency(PCE) and2.01 VOpen circuit voltage(VOC)Among themCertified steady statePCEreach31.6%This makes the performance of textured silicon-based stacked cells comparable to the current record of planar stacked cells, demonstrating the feasibility of achieving efficient passivation on complex industrial substrates and overcoming the passivation challenge brought by high surface area.
Core Innovation: Deep Field Effect Passivation Mechanism
PDAIThrough work function engineering In perovskite/C60Interface induced positive dipole moment, willConduction band offset(ΔEC,ETL)From the reference device180 meVReduced to the target device70 meVThe key breakthrough lies in the "deep field effect passivation" Expand electronic accumulation toThe entire perovskite absorption layer material, to change the average electron concentration in the absorption layer from the simulated1×10^14upgrade to4×10^15 cm^-3This is significantEnhanced the conductivity of the absorption layer and reduced carrier transport lossesBecoming a filling factor(FF)The main driving force for improvement.
Excellent long-term stability
Devices in outdoor environments along the Red Sea coast Continuous operation exceeding1000Maintain stable output for hours, wet heat test(85°C, 85%RH, 1000During the hour,PCECompared to the initial performanceRetention rate from73.7%upgrade to83.4%.PDAIHandle effectivelyFixed perovskite/C60Ionic migration on the interfaceIt significantly reduces the concentration of mobile ions and fundamentally improves the operational stability of the device.
Industrial application potential
This strategy is compatible with industryMixed two-step sedimentation methodMatching, suitable for textured silicon substrates with large pyramid sizes. The research has been validated throughImmersion coating methoddepositionPDAIIts scalability and mechanism of action enable it to successfully enhance performance in various perovskite compositions.
Reference from Science_SOI: 10.1126/science.adx1745
This article is rewritten by Enlitech for scientific research and academic sharing. If there is any infringement, please inform us by email
Last Article: Precautions for using light detectors
Next Article: Xenon lamp is a lighting source based on the principle of gas discharge