-
E-mail
xiaofeng.wan@universaltechco.com
-
Phone
13716839263
-
Address
Room 506, Science and Technology Building, No. 9 Zhongguancun South Street, Haidian District, Beijing
Global Junye (Beijing) Technology Co., Ltd
How to conduct Tafel polarization curve testing and analysis?
Date: 2025-12-03Read: 0
1. Choose the LSV method (Linear Sweep Voltammetry)
2. Set the following test parameters: relative to the open circuit potential, the polarization voltage scanning range is -300mV to+300mV, and the scanning speed is 1mV/s.

3. Data display: Select Tafel as the display format Preset in the data view. The X-axis displays the polarization voltage, and the Y-axis displays the logarithmic value of the polarization current (Log)10i)
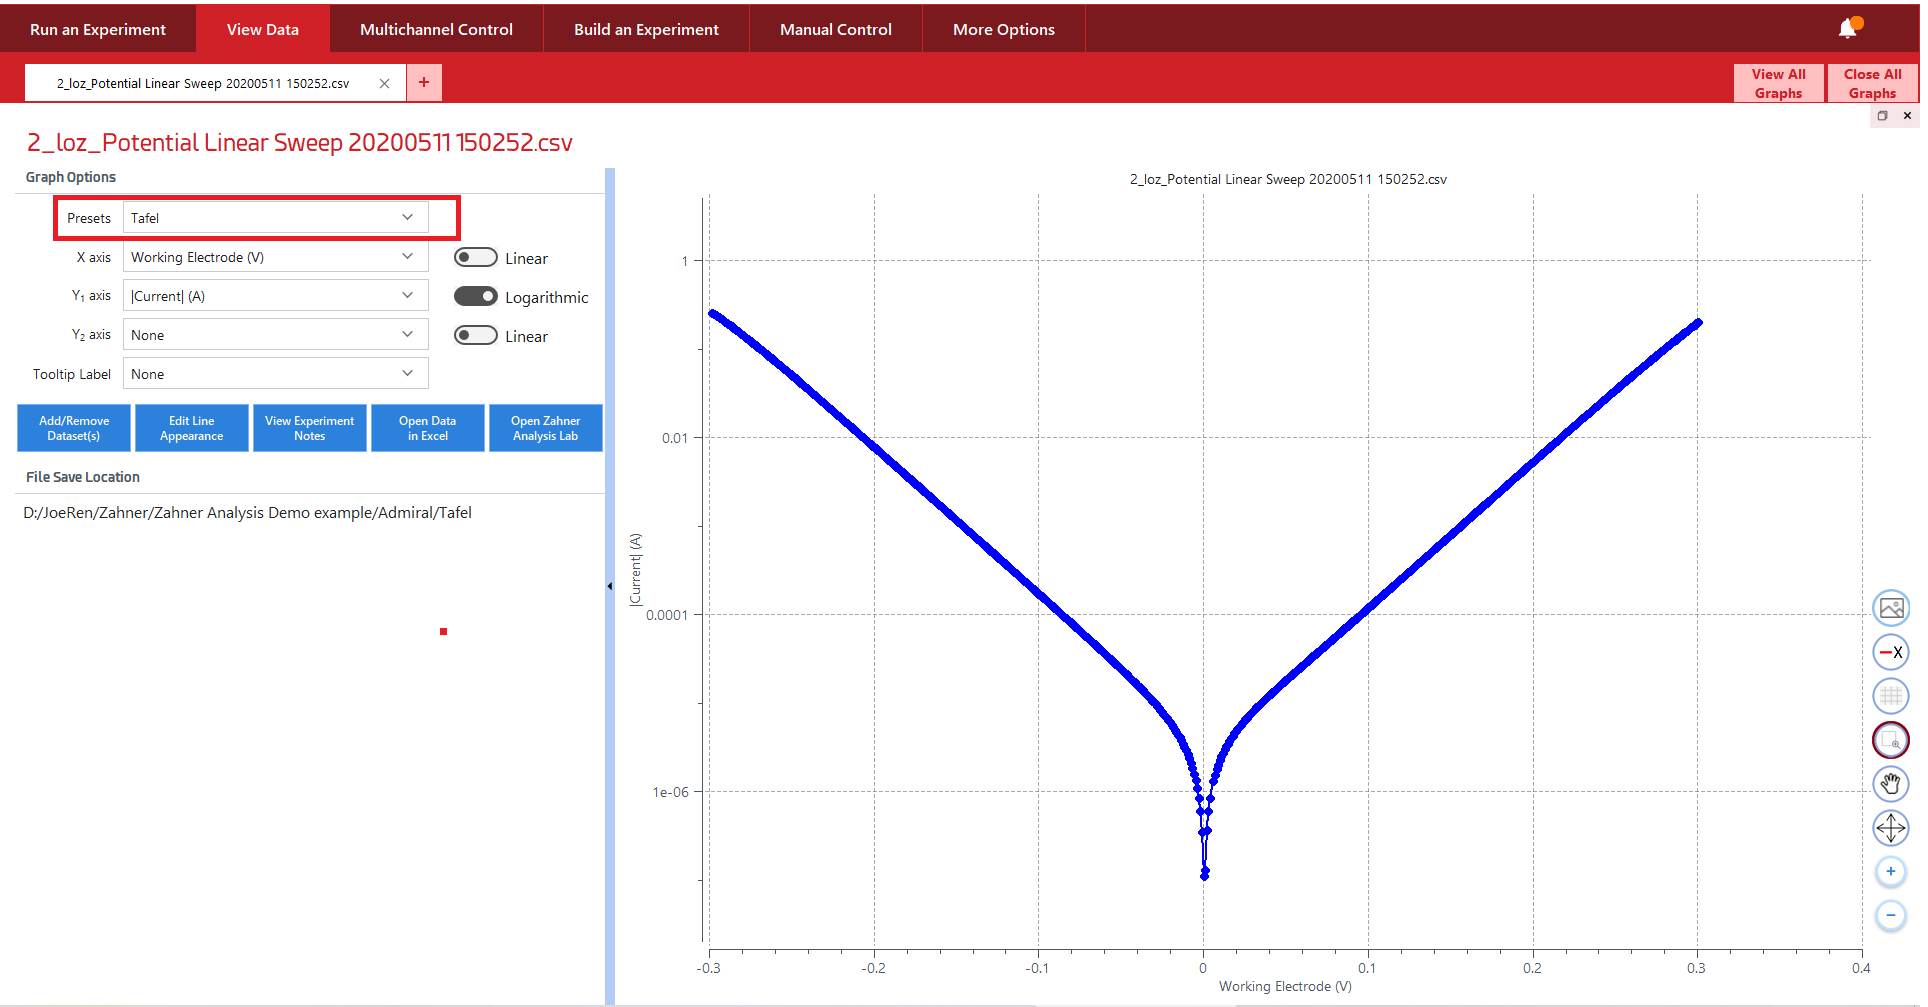
4. Data analysis: Open the LSV data using Zahner Analysis software, and set the Plot Presets to display the data in log I vs U format
Method (1): Tafel Slope Analysis
Click on the top toolbar Button, open the analysis settings interface. The following figure shows the classic Tafel analysis method.
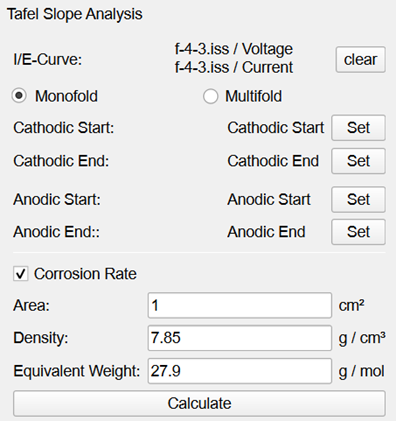
clickSetButton, select four positions in the anode and cathode regions of the curve to form two intervals. The selected interval should be a moderately polarized region, and the log I-U line segments in the interval show a linear relationship (Figure 1). Select Corrosion Rate, enter the actual area, density, and equivalent of the sample, and click Calculate to obtain the calculated Tafel constant, corrosion potential, corrosion current, polarization resistance, corrosion rate, and other results (Figure 2).
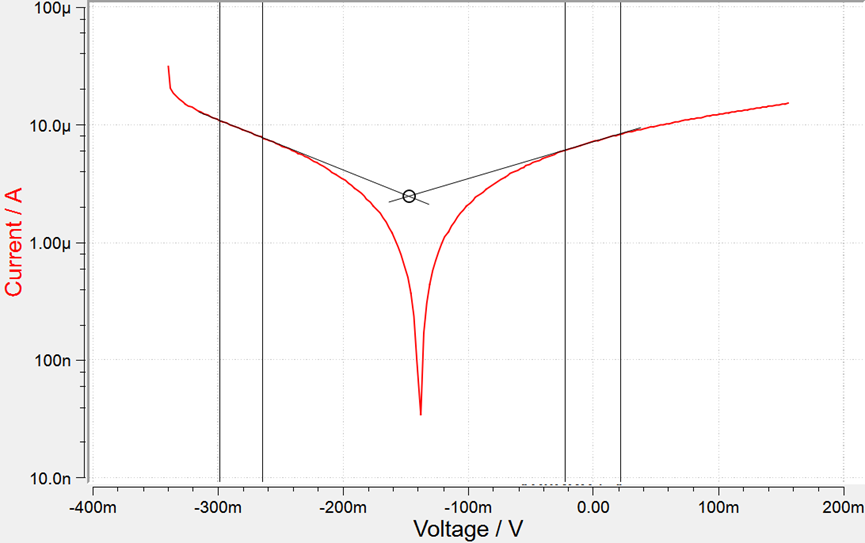
Figure 1 Tafel Region Selection
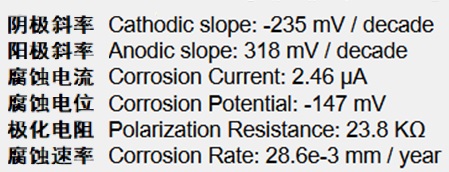
Figure 2 Tafel calculation results
Method (2): The Butler Volmer electrochemical kinetics equation and voltage current curve are as follows. The analysis software will perform automatic Tafel curve fitting based on this.
After fitting, j can be obtained0, Eeq, α. The numerical values of parameters such as z


Due to the lack of sufficient linear regions in the polarization curves of most corrosion systems, the influence of human selection is significant, and the Tafel analysis method of method (1) may not be suitable. Zahner Analysis software provides Butler Volmer equation fitting for polarization curves, which has the advantage of not requiring particularly obvious linear regions.
Click the button on the top toolbarOpen the analysis settings interface. As shown in the figure below:

Click the set button on the left and right boundaries, and select the range that needs to be fitted (Figure 3). You can switch to the Corrosion Rate page (on the right side of the figure), enter the area, density, and equivalent of the sample, and click the Butler Volmer Fit button to obtain Tafel constant, corrosion potential, corrosion current, polarization resistance, corrosion rate, and other results (Figure 4).

Figure 3: Selecting Data
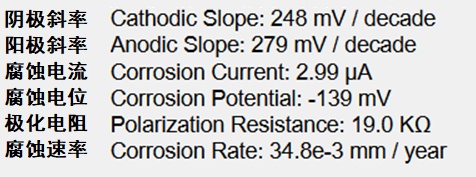
Figure 4Butler-Volmerfitting results