-
E-mail
info@excipolar.com
-
Phone
15395560171
-
Address
Building 5, Chuangyan Port, Changzhou Science and Education City, No. 18-50 Changwu Middle Road, Wujin District, Changzhou City, Jiangsu Province, China
Changzhou Puguang Huilian Technology Co., Ltd
Application of confocal microscopy Raman spectroscopy
Date: 2025-11-04Read: 6
Confocal microscopy Raman spectroscopy
Raman scattering is a type of inelastic scattering,It is used for research purposeslatticeandmoleculeofvibrationModerotateA spectroscopic technique for patterns and other low-frequency patterns within a system.The principle is shown in the following figure1As shown:
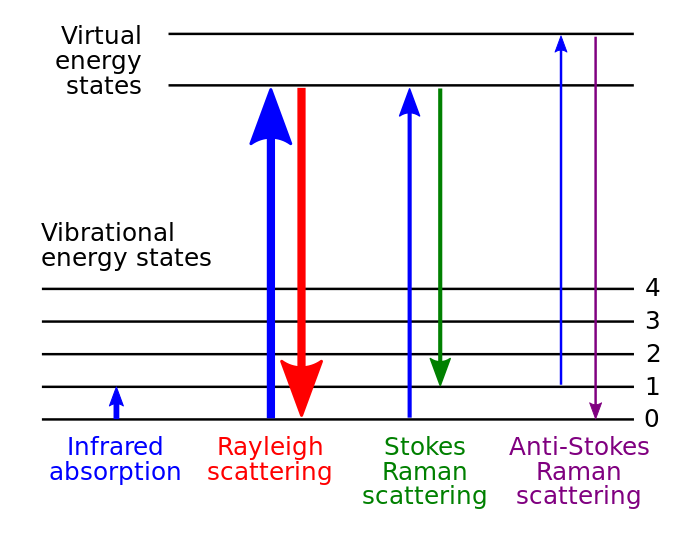
image1 Molecular transition energy level diagram. Different energy level transitions correspond to different Raman signals. The thickness of the line roughly indicates the strength of the signal.
Assuming that the scattering molecule was originally in the ground state, the vibrational energy levels are shown in the figure1As shown. When the incident light irradiates the molecule, the excitation light interacts with the moleculeMake the moleculepolarizationThe change in rate is equivalent to the virtual absorption of photons by molecules,thereby makingelectronic transitiontoA virtual energy level(Virtualenergystate)Electrons in the virtual energy levelinstantlyTransition to the lower energy levelAnd emit photonsThat isscattered light.Among them, the vast majorityscattered lightAt the same frequency as the incident light,In the process of interaction between molecules and light, there is no energy transfer, which is called elastic scattering, also known as Rayleigh scattering; And a very small portion of scattered incident light undergoes energy transfer with molecules or lattices, resulting in a change in the frequency of scattered light. This part of scattering is called Raman scatteringIn RamanspectrumIn Chinese, spectral lines with frequencies lower than the incident light frequency are also referred to as StokeslineAnd the spectral lines with frequencies greater than the incident light frequency are called anti Stokes lines.
Due to the fact that the vibration modes of different molecules or atomic groups are the same, the frequency of their Raman scattering light is also specific. Therefore, Raman spectroscopy is also known as“Molecular fingerprint”Spectrum. Raman spectroscopy has a wide range of applications, which can characterize the chemical composition, chemical structure, phase morphology, crystallinity, and molecular interactions of materials. In addition, it can also obtain information on impurities, stress, and temperature within the crystal.
With the continuous reduction of the size of the detected substances in various application fields, especially entering the micrometer or even nanometer scale, the analysis of Raman spectra requires an improvement in its spatial resolution. Therefore, confocal microscopy Raman spectroscopy detection technology has emerged, which combines the microscopic magnification function of microscopes and confocal poresThe limited domain functionThe spatial resolution of Raman detection can be increased to the optical diffraction limit, which is at the micrometer or even sub micrometer level. image2This is a typical optical path diagram of confocal microscopy Raman spectroscopy
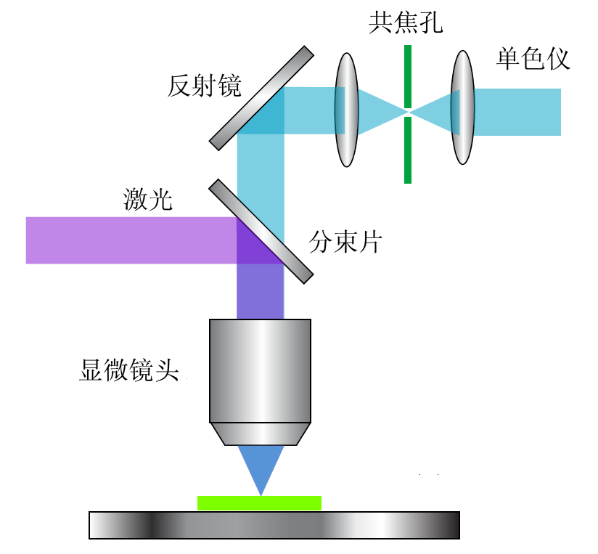
image2 Principle diagram of confocal microscopy Raman spectroscopy
Confocal Raman spectroscopy can achieve three-dimensional resolution. In addition to analyzing samples at the micro nano scale, it can also analyze different layers and interfaces in multi-layer thin films, as well as impurities or pollutants under the surface of transparent samples.
By point scanning or surface scanningmappingFunction, capable of achieving Raman spectroscopyWei orThree dimensional imaging. By extractionmappingThe Raman information of each point in the Raman imaging can display various material properties(Composition, structure, phase, polymorphism, stress, crystallinity)The spatial distribution.
Confocal microscopy Raman spectroscopySpectral applications
1.Chemical field:
Chemical bonds and symmetrical moleculesThe vibration frequencies are all specificthereforeRaman spectroscopyprovide了As a molecular identificationImportant meansFor example,SiO, Si2O2,andSi3O3The vibration frequency can be identified and serves as the basis for coordination analysis in infrared spectroscopy and Raman spectroscopy.The size, intensity, and peak shape of Raman shift are important criteria for identifying chemical bonds and functional groups. By utilizing polarization characteristics, Raman spectroscopy can also serve as a basis for determining molecular isomers. In catalytic chemistry, Raman spectroscopy can provide structural information of catalysts and surface substances, as well as real-time analysis of catalyst preparation processes. Raman spectroscopy is used to study electrodes/The structure and properties of solution interfaces are important methods for in-depth study of fundamental issues such as electrochemical interface structure, adsorption, and reaction at the molecular level, and can be applied in fields such as electrocatalysis, corrosion, and electroplating.
(Reference:Kraytsberget.al.,Journal of Power Sources 282.(2015):294-298)
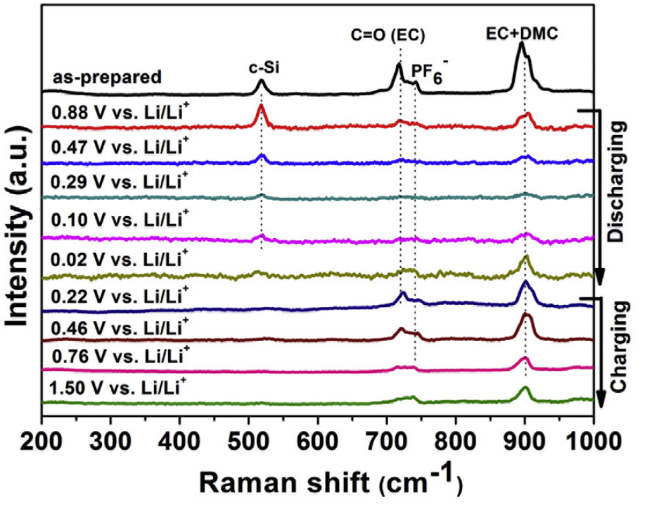
image3 Liion batterySiIn situ Raman spectroscopy of electrodes during charge and discharge processes
In evaluatingNa₂SImpurities in the precursorWdopingNa₃PS₄Composite ShadowringIn the middle, throughRaman spectroscopyIt can be analyzed thatNa₂S-d In 481The498 cm ⁻¹Multiple sulfides appear at the location(Na₂Sₓ)Characteristic peak,Na₂S-c In 967、1005The1025 cm ⁻¹Appearing hereSOₓrelated peakNa₂S-p In2560 cm ⁻¹There is a weak peak indicating trace amounts NaSH(Reduction products of polysulfides during purification process), all three are in207 cm ⁻¹There are Na₂S Strong vibration peakTherefore, when combined with other technologies, it can be inferred that:Na₂S-c Mainly includesSOₓImpurities,Na₂S-d Containing polysulfides and trace amountsSOₓ,Na₂S-p Basically free of these two types of impurities, providing a precursor with controllable purity for subsequent research on the influence of different impurities on electrolyte synthesis.(References:Felix Schnaubeltet.al., Energy Mater. 2025, e03047)
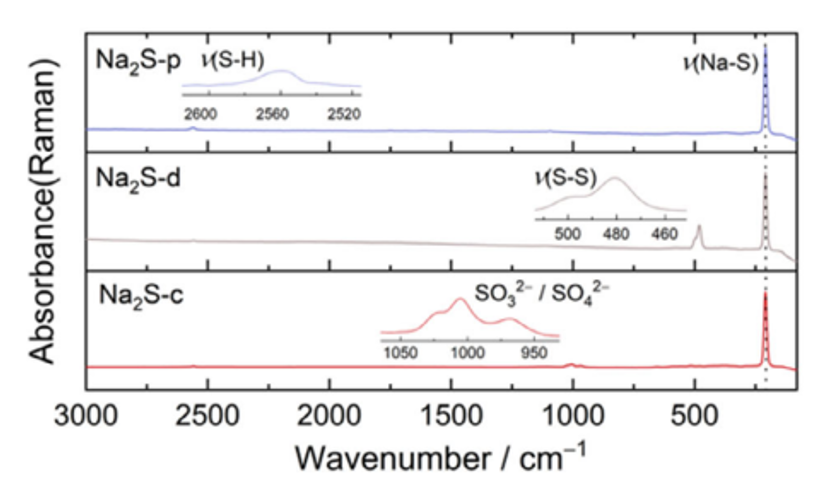
image4 Raman spectroscopy analysis for commercial use Na₂S-cDry processed Na₂S-dPurification treatment Na₂S-pStructure and Impurity Distribution
2.food safety
Raman spectroscopy is used to detect non dairy fat impurities of different concentrations in beef puff pastry, including vegetable oil, mineral oil, and pig body fat. In774 cm−1(Alkanes)C–C/C–HExpansion and contraction)971 cm−1(CCHIn-plane oscillation)1265 and 1656 cm−1(cis)-RHC=CHRThe characteristic Raman peaks at the vibration can clearly distinguish these dopants.(Reference:Diniset.al.,Food Control,2025,178,111481)
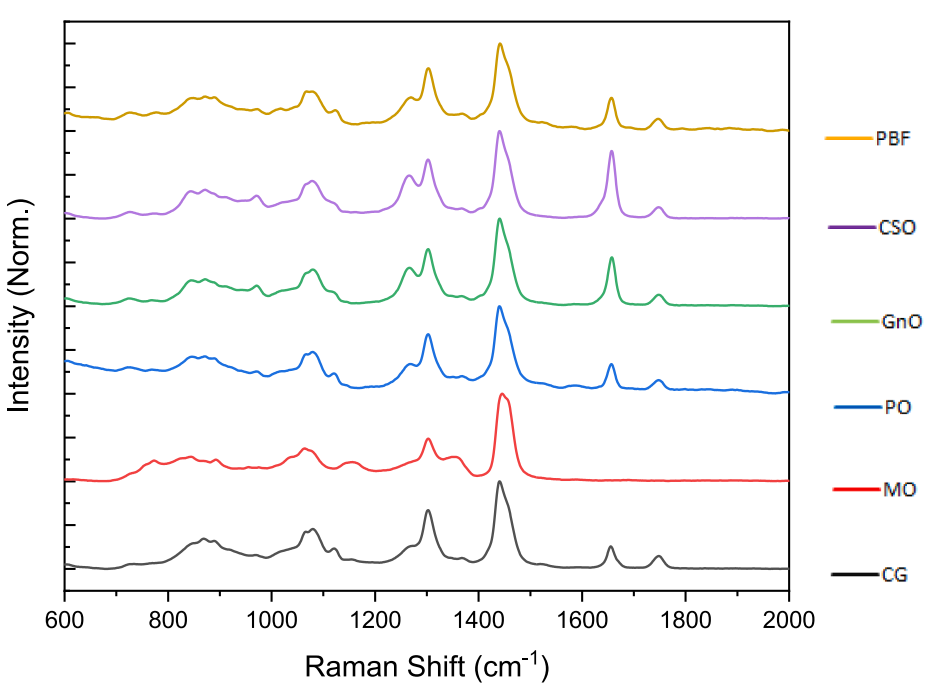
image5 .butter(CG)Mineral oil(MO)Palm oil(PO)Peanut oil(Gn0)Cottonseed oil(CSO)And pig body fat(PBF)The average normalized Raman spectra
High precision and non-destructive quantitative monitoring of nitrate in greenhouse spinach was achieved through Raman spectroscopy technology,By combining chemometric models, highly correlated features with nitrate concentration were extracted from complex spectra, achieving rapid and accurate quantification of nitrateProvided practical solutions for precision agriculture. (Reference:Paoloet.al.,Journal of Agriculture and Food Research,2025,21, one01839.)
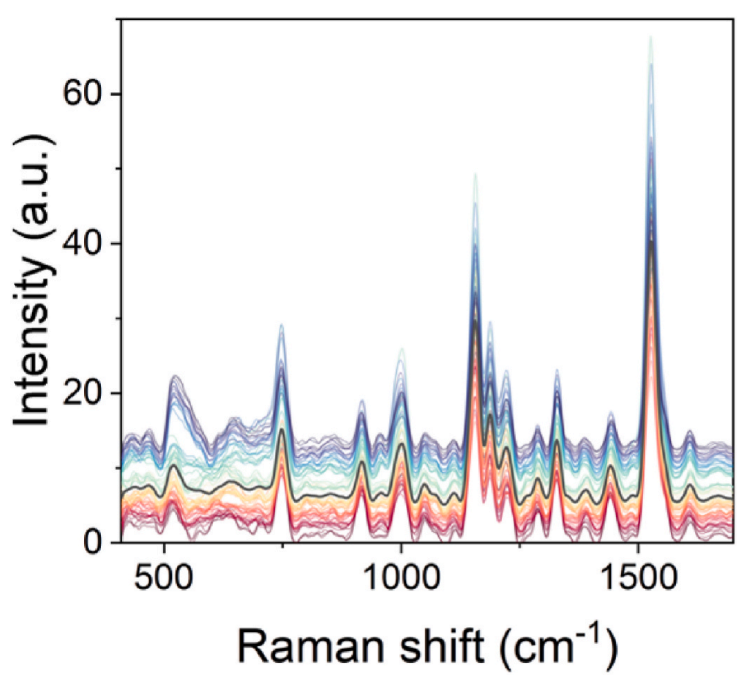
image6 Stacked Raman Spectroscopy of Spinach Leaves
Spectral markers within a specific range, derived from the vibrational patterns of anthocyanins and carbohydrates, can accurately distinguish blueberryThe fine-grained difference between strawberries, raspberries, and blackberries,Raman spectroscopyProvided a deeper understanding of the molecular composition of these berries and laid a solid foundation for future research on food safety and quality control,Provided a fast, non-destructive, and inexpensive method for quality assessment in the food industry.(Reference:Stephenet.al.,Journal of Food Composition and Analysis,2025,137:106898)
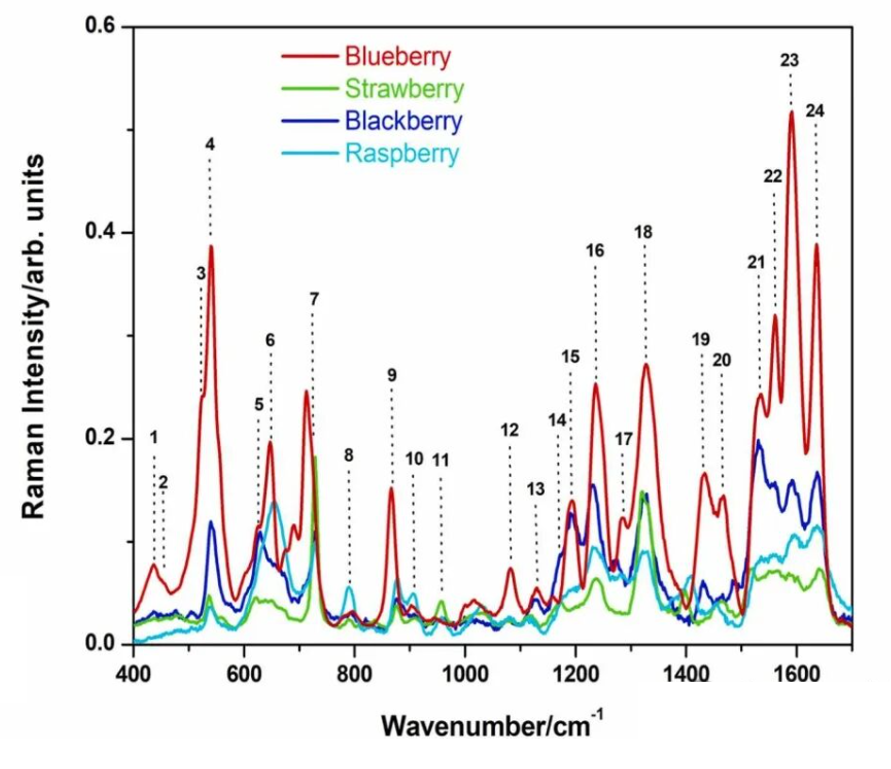
image7 four typesBerry sample extractionRaman spectroscopy
3.Solid state physics:
Characteristics of raw materials, measurement of temperature, and searching for samplesCrystal orientationFor example,The broadening of Raman spectra can characterize the quality of crystals by distinguishing between single crystals, polycrystals, and amorphous materialsphonon modeMonitor and be able to target twoDimension MaterialQuickly determine its layers and thicknessIn addition, Raman spectroscopy can monitor solidsbodyLow frequency excitation, for exampleplasmaExcitation of magnetic oscillators and superconducting gases.passStokeslineandagainstStokes lineStrength ratioCan determine the temperature of the crystal lattice.(References:Biplabet.al.,App. Phys. Express, 7, 022401 (2014))
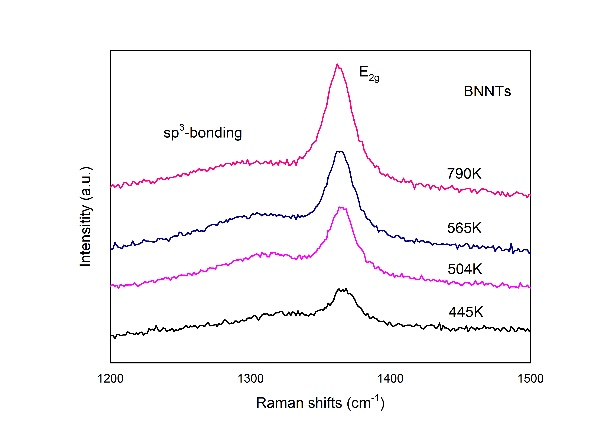
image8 Boron nitride nanotubes(BNNT)Raman spectroscopy, in which the lattice temperature is calculatedE2gThe intensity ratio of Stokes and anti Stokes lines of the pattern is obtained.
4.Life Sciences
Single cell Raman spectroscopy can provide a large amount of information on intracellular nucleic acid, protein, lipid content, etc. It can dynamically monitor changes in cell structure in real time without damaging cells, and can be applied in cellular level disease diagnosis (such as cancer cell detection), cell drug treatment, single-cell life activity detection, and other fields.(Reference:Freudigeret.al.,Science, 322, 1857 (2008))
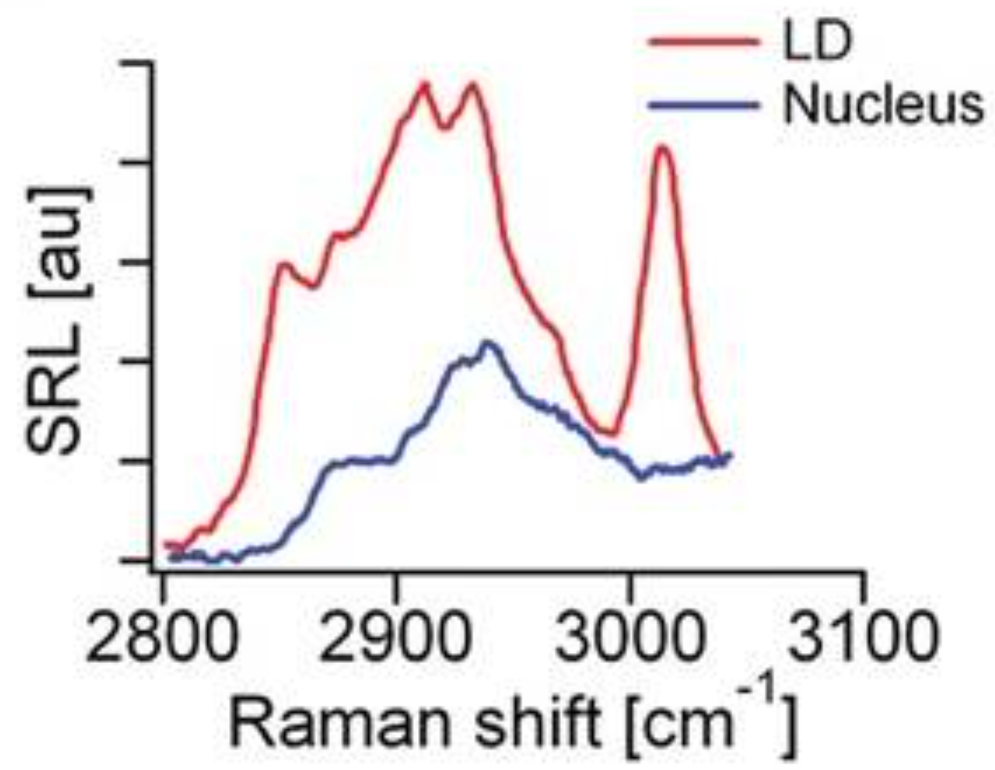
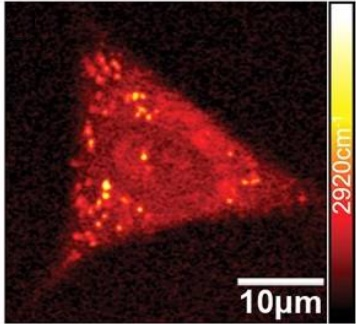
image9 Stimulated Raman scattering spectra of intracellular lipid droplets and nuclear regions (left) and stimulated Raman imaging (right).
In addition to animal cells, confocal Raman spectroscopy alsoUsed for unmarked and non-destructive visualization of the spatial distribution and structural characteristics of chemical components in the cell walls of cucumber (root, stem, and leaf tissues),Simultaneously improving at the molecular and morphological levelsProvide multidimensional information on the complex tissue structure of plant cell walls.1598, 1621, 1658 cm ⁻¹Peak waiting for positionFor lignin,1092 cm ⁻ ¹ (C-C, C-Ostretching vibration)and1337 cm ⁻ ¹ (HCC, HCODeformation vibration)The peak indicates that cellulose is the main component of the cell wall,1523, 1156, 1005 cm ⁻¹The Strong Peakforcarotenoidcharacteristic peak. (Reference:Beumet.al.,Plants 2018, 7, 7)
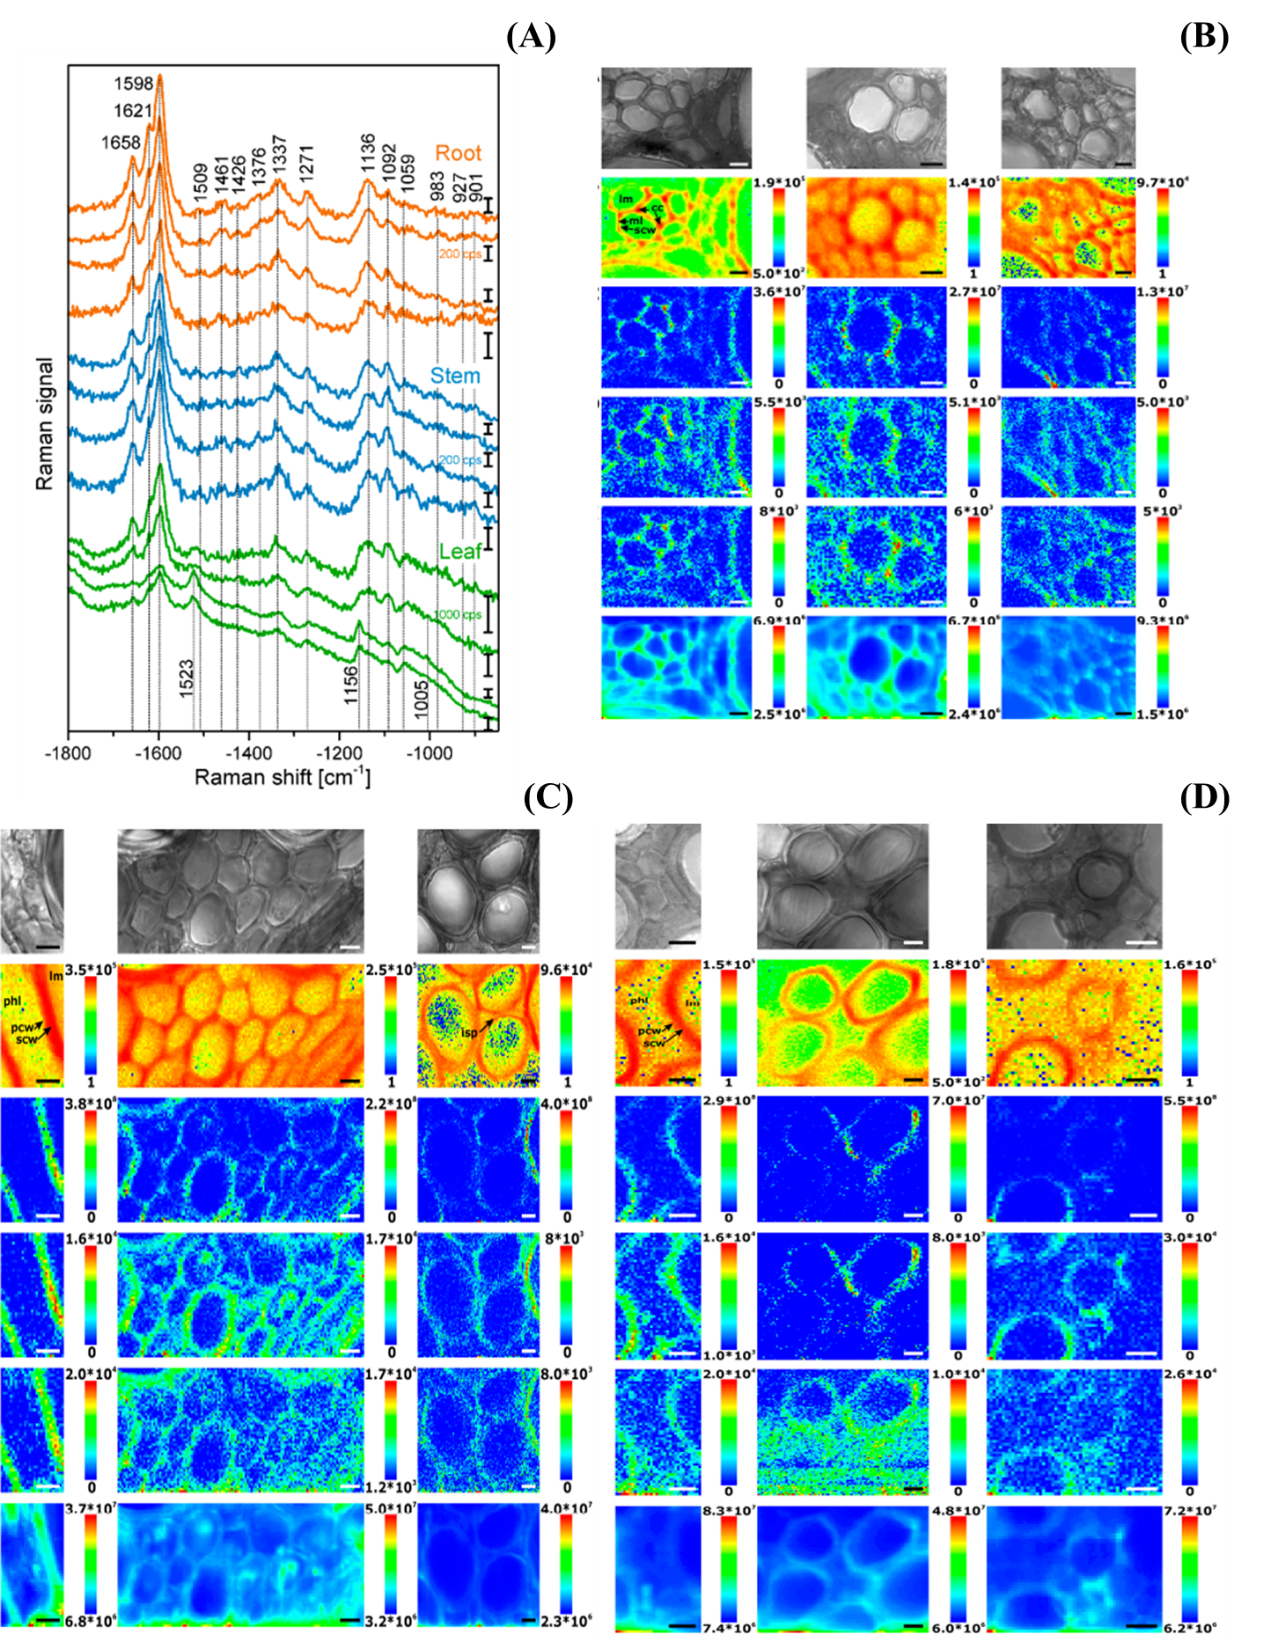
image10 (A) Raman spectra collected from different subregions of xylem cell walls in roots, stems, and leaves
lignin、cellulose、Class HuluoBu SuRaman imaging at different locations(B)root(C)stem(D)leaf
5.semiconductor
Raman spectroscopy can be used to analyze the purity of semiconductor materials, impurities, defects, or contaminants, study the alloy composition, superlattice, or heterostructure in compound semiconductors, and stress or strain characteristicsThe damage distribution of the semiconductor after ion implantation, as well as the quality, composition, and carrier concentration of the epitaxial layer.

image11 singleZnOMicroscopic images of nanorings (left), conventional Raman imaging results (middle), and polarized Raman imaging results (right).
5.Material Analysis
Raman spectroscopy is a powerful tool for studying material structures in materials science,Structural analysis can be performed on various thin films, such as,singlecrystal, manycrystal, MicrocrystalAnd amorphous silicon, boronated amorphous silicon, hydrogenated amorphous silicon, diamond, etcdiamondWaiting for carbon materialswaitIt can analyze the phase structure of high-temperature resistant materials and study the quantum size effect of various nanomaterials,Analyze the molecular structure and composition, stereoregularity, orientation of crystallization and molecular chains, and molecular interactions of polymer molecules.(Reference:Wanget.al.,Opt. Mater. Express, 10, 1092 (2020))
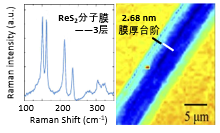
image12ReS2Raman Spectroscopy of Molecular Membranemapping.
More Raman spectroscopy techniques:
1.Resonance Raman Spectroscopy
Usually, the excitation light energy of Raman spectroscopy does not match the absorption energy level of molecules or the energy band in solids, so the absorption of excited photons by molecules is“empty”The absorption of electrons, which is also referred to as the transition of photons to an electron absorption state at the beginning of this article“Virtual energy state”However, when the excitation light energy is close to or coincides with a certain electron absorption peak of the molecule being tested, the intensity of one or several characteristic Raman bands of this molecule can reach that of the normal Raman band104Multiple or combined vibrational spectra with intensities comparable to the fundamental frequency, which are difficult to occur in normal Raman effects.routineThe principle of Raman and resonance enhanced Raman is shown in the figure3As shown.(Reference:Louis et al.,Technol. Cancer Res. Treat. 12(4),371 (2013))
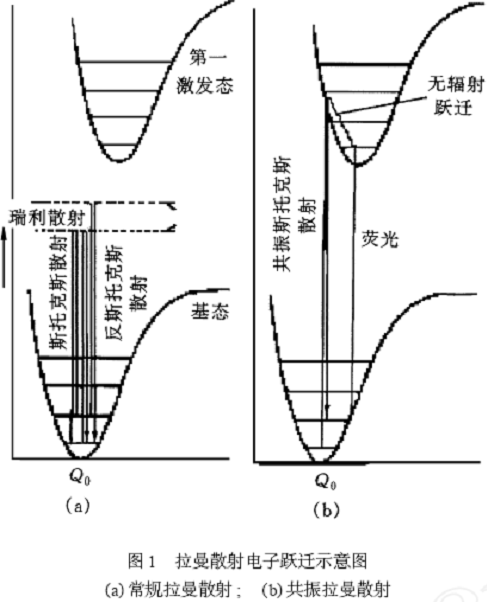
image13 Schematic diagram of Raman scattering electron transitions.(a)Conventional Raman scattering; (b)Resonance Raman Scattering
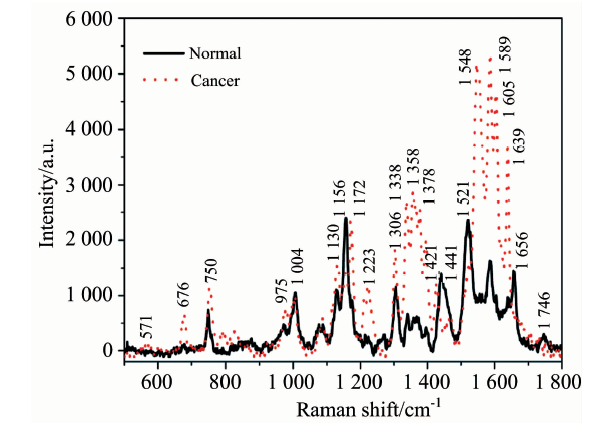
image14 Resonance Raman Spectroscopy of Normal and Carcinogenic Breast Tissue(532nmStimulate)
2. Surface enhanced Raman spectroscopy(SERS)
On the surface or sol of some specially prepared metal good conductors,The Raman scattering signal of adsorbed molecules is greatly enhanced compared to ordinary Raman scattering signals, and it can be mainly divided into the following two mechanisms:.
(1)Electromagnetic field enhancement mechanism,Mainly due to surface plasmon resonance occurring on the metal surface,This enhancement effect is closely related to the size, shape, and aggregation structure of metal nanoparticles;
(2)The chemical enhancement mechanism mainly reflects the properties of the chemical active sites on the surface of nanoparticles, which are closely related to the bonding between probe molecules and metal surfaces, as well as the molecular adsorption orientation.
Surface enhanced Raman spectroscopy overcomes the disadvantage of low sensitivity in Raman spectroscopy and can obtain structural information that is not easily obtained by conventional Raman spectroscopy. It is widely used in surface research, adsorption interface surface state research, interface orientation and configuration of biological sized molecules, conformation research, structural analysis, etc. It can effectively analyze the adsorption orientation, changes in adsorption state, and interface information of compounds at the interface.(Reference:Koubaet al.,Raman.Spectrosc., 49(9),1426 (2018))
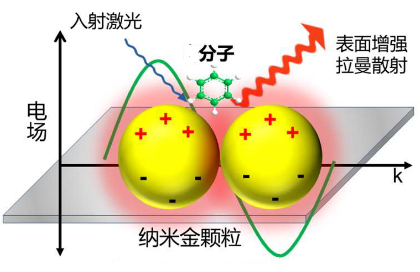
image15 Schematic diagram of surface enhanced Raman scattering principle.

image16 Surface enhanced Raman spectroscopy of biomolecules in blood, with the upper image showing the Raman spectra of biomolecules measured on a glass substrate and the lower image showing the biomolecules in the nanometer rangeAgRaman spectra measured on the surface of particles.
3 Near field Raman spectroscopy
With the maturity of near-field optical technology, the near-field scanning microscope system, as an external light path, isRamanBy combining spectrometers, a super-resolution near-field can be formedRamanSpectral analysis system.
Near field Raman spectroscopy can simultaneously obtain super-resolution physical and chemical information of the sample. Raman spectroscopy represents the chemical structure information of the sample, while morphology is the physical information of the sample. By combining the characteristics of near-field optical scanning microscopy, Raman spectra can be collected point by point from the sample, forming Raman spectra at a specific wave number.It is possible to study the structure of substances at the single-molecule level.(Reference:Steidtneret al.,PRL, 100, 236101 (2008))

image17 Schematic diagram of near-field Raman configuration.

image18BCBRaman spectra of molecules with and without needle tip enhancement.