-
E-mail
info@excipolar.com
-
Phone
15395560171
-
Address
Building 5, Chuangyan Port, Changzhou Science and Education City, No. 18-50 Changwu Middle Road, Wujin District, Changzhou City, Jiangsu Province, China
Changzhou Puguang Huilian Technology Co., Ltd
Application of Scanning Photocurrent Imaging System
Date: 2025-12-01Read: 5
Scanning photocurrent microscope
Scanning photocurrent microscope(ScanningPhotoCurrentMicroscopy,SPCM)It is a high-precision device used to detect the distribution of photocurrent intensity in materials. This technology combines optical excitation and electrical measurement, by scanning the laser point by point and synchronously recording the photocurrent signal, to achieve spatial distribution imaging of the photoelectric properties of the material surface. The core principle involves the excitation, separation, and collection of photo generated charge carriers, as well as the spatial mapping of signals. This process can be used to measure the response signal of optoelectronic materials, thereby characterizing their optoelectronic properties. When the laser is focused on the surface of the material, the energy of the incident photons is absorbed and electrons are generated-Hole pairs (photo generated charge carriers). Under the action of built-in electric field or external bias voltage, these charge carriers will be effectively separated, forming directional photocurrent. Scanning photocurrent microscope“Photoexcitation-Electric response”The precise spatial mapping visualizes the photoelectric activity of material surfaces, making it an important tool for studying carrier dynamics, interface characteristics, and defect engineering in nanodevices. The core of this technology lies in the effective combination of high-resolution optical scanning and weak electronic signal extraction. In cutting-edge fields such as topological quantum materials and flexible optoelectronic devices, this technology demonstrates enormous potential for application.

image1.Schematic diagram of scanning photocurrent
Application of Scanning Photocurrent Technology
1. Device Failure Analysis
The performance of perovskite solar cells will vary over timeThe transitionAnd decay,thusCausing device instability. Traditional current density-Voltage(J-V)Curve measurement(asimageashown)Can only reveal the overall performance parameters of the device from a macro perspective, such as efficiencyandfill factorwaitBut it cannot reveal the microscopic root cause of performance degradation.

image2.(a)Heterojunction perovskite solar cell structure (b)TraditionalJ-Vcurve
based onScanning photocurrent microscopeavailableDistribution diagram of photocurrent on the surface of the device.Uniform and high photocurrent distribution diagram (as shown in the figure)bshown)Representing a healthy and high-performance device, its charge generation and collection efficiency is consistent throughout the entire active region. And when the device ages and fails, its photocurrent distribution diagram (as shown in the figure)canddshown)It will become extremely uneven. The bright red color appearing in the picture/The yellow spots represent local high current areas, which are usually small local short circuit points or leakage channels that dissipate energy, reduce the output voltage and fill factor of the device. And large patches of blue/The purple area represents low or no current“dead zone”The materials in these areas may have degraded, passivated, or had poor contact with the electrodes, making it difficult to effectively generate or transfer charges, resulting in a decrease in overall current. Scanning photocurrent microscope(SPCM)It is a powerful non-destructive diagnostic tool. It will degrade the macroscopic performance(J-VThe decrease in efficiency displayed by the curve is directly related to the uneven distribution of current at the microscopic and spatial levels. By visualizing the leakage points and dead zone failure points in the device,canThis provides researchers with intuitive evidence to analyze the specific causes of performance degradation in perovskite solar cells, such as ion migration, electrode corrosion, interface degradation, etc. This provides a crucial direction for guiding material synthesis, optimizing device structures, and improving cell stability. (Reference:Muehlbrandtet al.,RSC Adv., 2017, 7, 42973–42978)
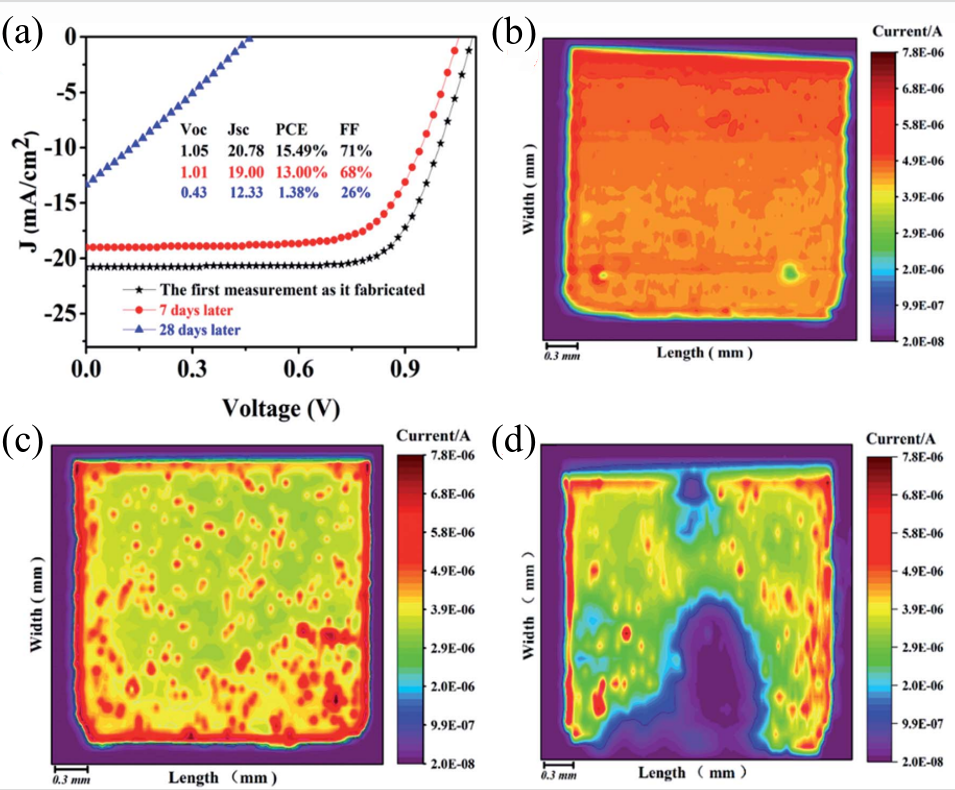
image3.(a)ByJ-VCurve quantization device performance (b-d).0,7Oh my god,28The photocurrent diagram of the Tian device
2. Spontaneous photovoltaic effect in two-dimensional heterostructures
Traditional photovoltaic devices rely on the electric field inside the artificially constructed asymmetric structure to separate photogenerated charges. And this study demonstrates a novel mechanism: utilizing two different two-dimensional materials(WSe₂andBP)In a heterojunction formed by simple stacking, there is no need for any manual constructionPNBy relying solely on the inherent physical asymmetry of the interface between the two materials, a directional photocurrent can be generated under illumination. This effect is called“spontaneous”Photovoltaic effect. Based on scanning photocurrent microscope(SPCM)This tool is used to discover and confirm this phenomenon. As shown in the figure, a small laser beam is focused and scanned across the entire surface of the heterojunction device, and the magnitude and direction of the photocurrent generated at each point are accurately measured under zero applied bias.SPCMThe drawn photocurrent distribution diagram intuitively shows that in the overlapping area of the two materials, i.e. at the heterojunction interfaceSignificant and uniform photocurrent signal. This key image evidence directly proves that the interface itself is an efficient photoelectric conversion active area. The root cause of this spontaneous photovoltaic effect lies in the natural symmetry breaking at the heterojunction interface.WSe₂andBPHas different crystal structures and electronic properties, such as different spatial symmetries, band structures, etc. When they are combined together, an intrinsic and directionally fixed built-in electric field is formed at the interface. The function of this built-in electric field is equivalent to a“automatic”The charge separator generates electrons when illuminated-When there are hole pairs, the electric field drives them to move in a directional manner, resulting in a net current. Its significance lies in providing a new technological path for achieving ultra-thin, non complex doping processes, and high-performance new photovoltaic and optoelectronic detection devices.(Reference:Akamatsuet al.,Science 372, 68–72 (2021))
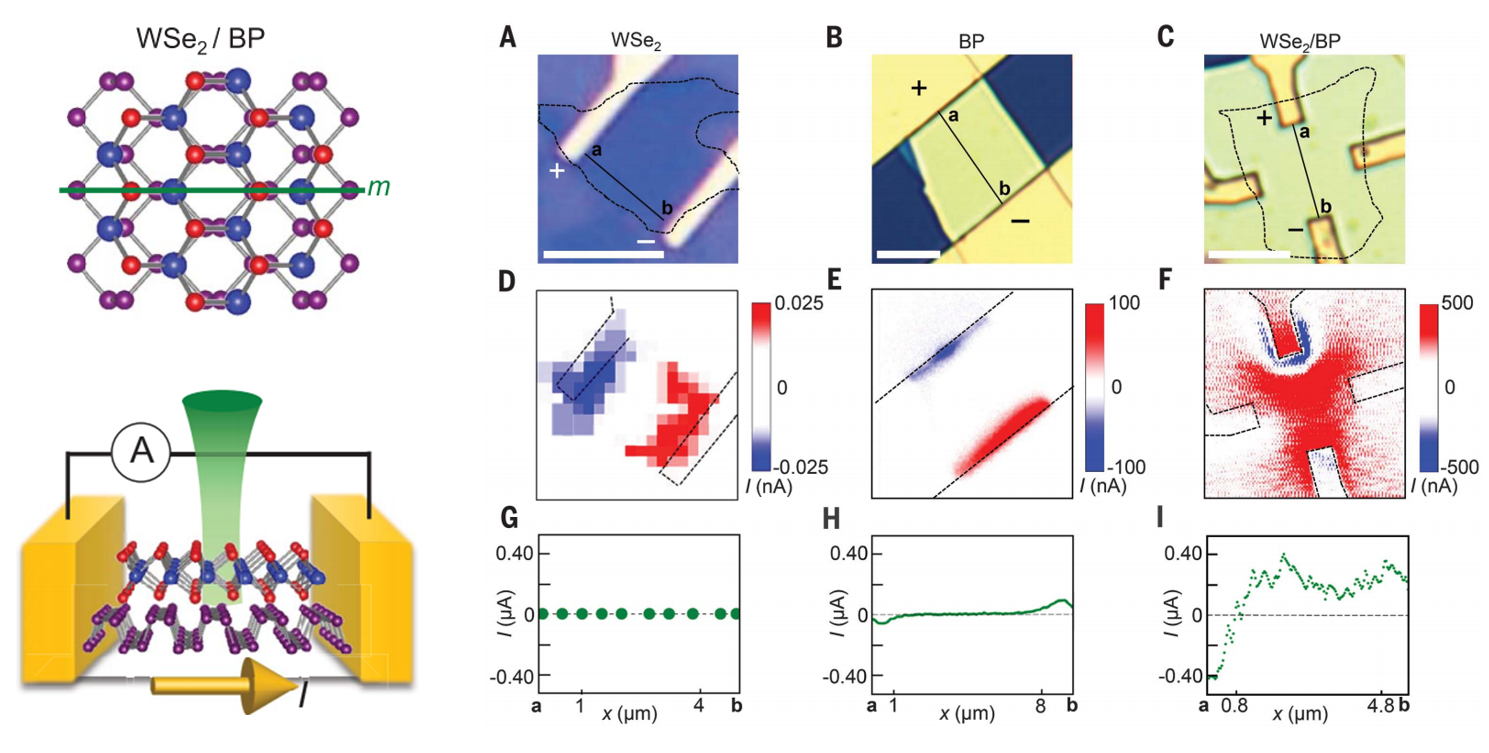
image4. WSe₂TheBPAnd its heterojunction comparison:(A-C).Light mirror(D-F).Photocurrent mapping diagram(G-I).Scanning image of photocurrent first
3. The photovoltaic effectFlexural lightambush
MoS2coverVO2On the nanobelt, researchers used a scanning photocurrent microscope to scan the device and plotted the spatial distribution of photocurrent. The results clearly showed that the Z-strong photocurrent signal was highly concentrated inVO₂nanoribbonThe edge region overlaps with the high strain gradient region.(Reference:Largeetal.,NatNanotechnol,2021 Aug; 16(8):894-901)

image5. Under laser irradiation1Point2Current of devices under point and no illumination conditions-Voltage curve. The illustration is a schematic diagram of the cross-section of the equipment.1,2To measure the location.(a). MoS2ofE12gRaman imaging results of the pattern(b).Photocurrent imaging results of devices under laser irradiation
4. Interface Analysis
Scanning photocurrent technology with loan agreement150 nmofHigh spaceResolution, precise mapping and quantitative analysis of graphitealkeneNanoscale potential distribution within transistor channels. Research has found that metal electrodes(Ti/Pd/Au)WillpType doping of graphene below, and this effect will extend into the channel0.2-0.3μmThus, inntypeConductive area along the channelFormed a keyp-n-pStructure. By numerically integrating the photocurrent distribution, the researchers quantitatively reconstructed the band diagram of the structure, which directly explains the graphitealkeneCommon asymmetry in electron hole conduction in transistors——Its root lies inp-nBring it overExtra contact resistance, rather thanbody typeMaterial properties. In addition, this technology has been successfully applied to detect single-layer and multi-layer graphitealkeneThe charge transfer at the interface and the built-in electric field indicate that it is also a powerful tool for studying the electronic behavior of low dimensional heterojunction interfaces.(Reference:Muelleret al.,PHYSICAL REVIEW B 79, 245430 (2009))
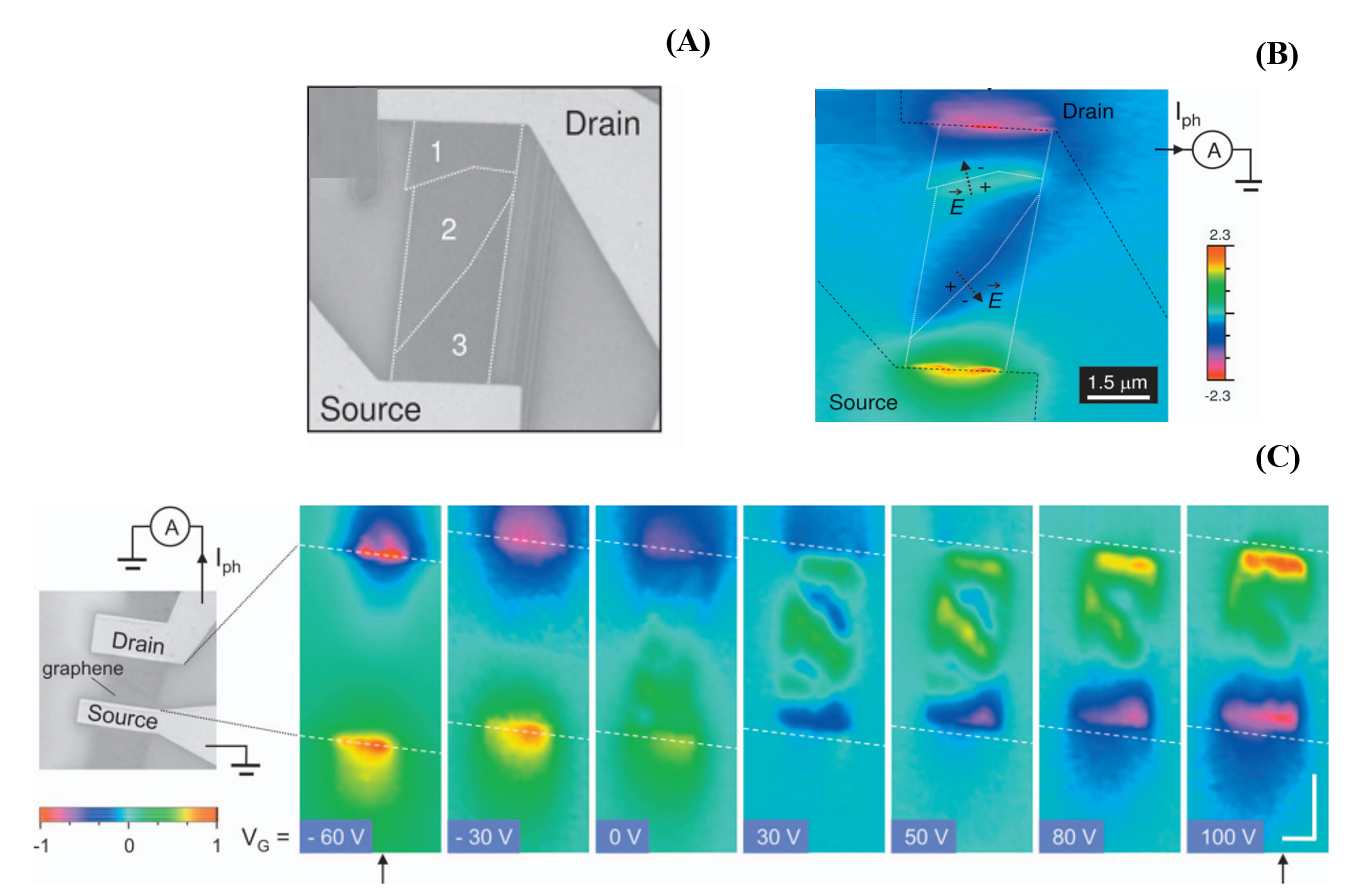
image6.(A). Device materialsComposition of different layers(B). Photocurrent images, except for metal electrodesStrong signal at the interfaceOutside, inSingle layer and multi-layerClear photocurrent signals were also observed at the interface (white dashed line), with opposite polarities on both sides of the interface(C).graphitealkenetransistorAppearance andscanphotocurrent responseWith grid voltageevolutionary process
5. Brain neuron electricityfeature
The complex neural circuits connected by submicron synapses in our brain require techniques that can map neural networks with ultra-high spatiotemporal resolution to decipher potential mechanisms in multiple aspects of neuroscience. By combining graphene transistor arrays with scanning photocurrent microscopy, we can detect the electrical activity of individual synapses in primitive hippocampal neurons. By directly measuring the local conductivity changes of graphene photoelectric probes during neuronal processes, we can estimate the extracellular potential changes of individual synapses during depolarization. The ultrafast nature of graphene allows for decoding the activity patterns of various synapses with sub millisecond time resolution through its photocurrent response. This new neural technology provides promising potential for recording the electrophysiological results of individual synapses in neural networks.(Reference:Breweret al.,Nano Letters 2018,18(9). 5702–5708)

image7. (A)Integrated graphitealkeneFour cavity neurons of transistors-Schematic diagram of microfluidic device for co culture of glial cells. (B)Schematic diagram of scanning photocurrent measurement. Diffraction limited laser spot passes through transparent cover glass to scan graphene beneath neurons. (C)Differential Interference Contrast of Graphene Transistors in Neural Networks(DIC). Two black rectangles are opaque beneath grapheneAuElectrode membrane. In the cultivation of5Oh my god, use it(d)mCherry-Synaptosin (red) and(E)mCerulean(Blue) Differentially transfect neurons and maintain co culture with glial cells. partUh...Magnified fluorescence image of the square area in medium quality red:(F)mCeruleanblue;(GofmCherry-Synaptosin (red);(H)mCeruleanandmCherryThe overlap of synaptophysins;And(I)GFP-GCaMP6s(Green).
By extracting extracellular substancesK +Concentration from4 mMRaise to60 mMTo study chemical induced explosions.DICFluorescence images are used to identify synaptic contacts (Figure)3A -F)Then the laser beam is focused on the corresponding graphene-At synaptic connections, every50 MsCollect photocurrent response to record local electrical activity at the junction.
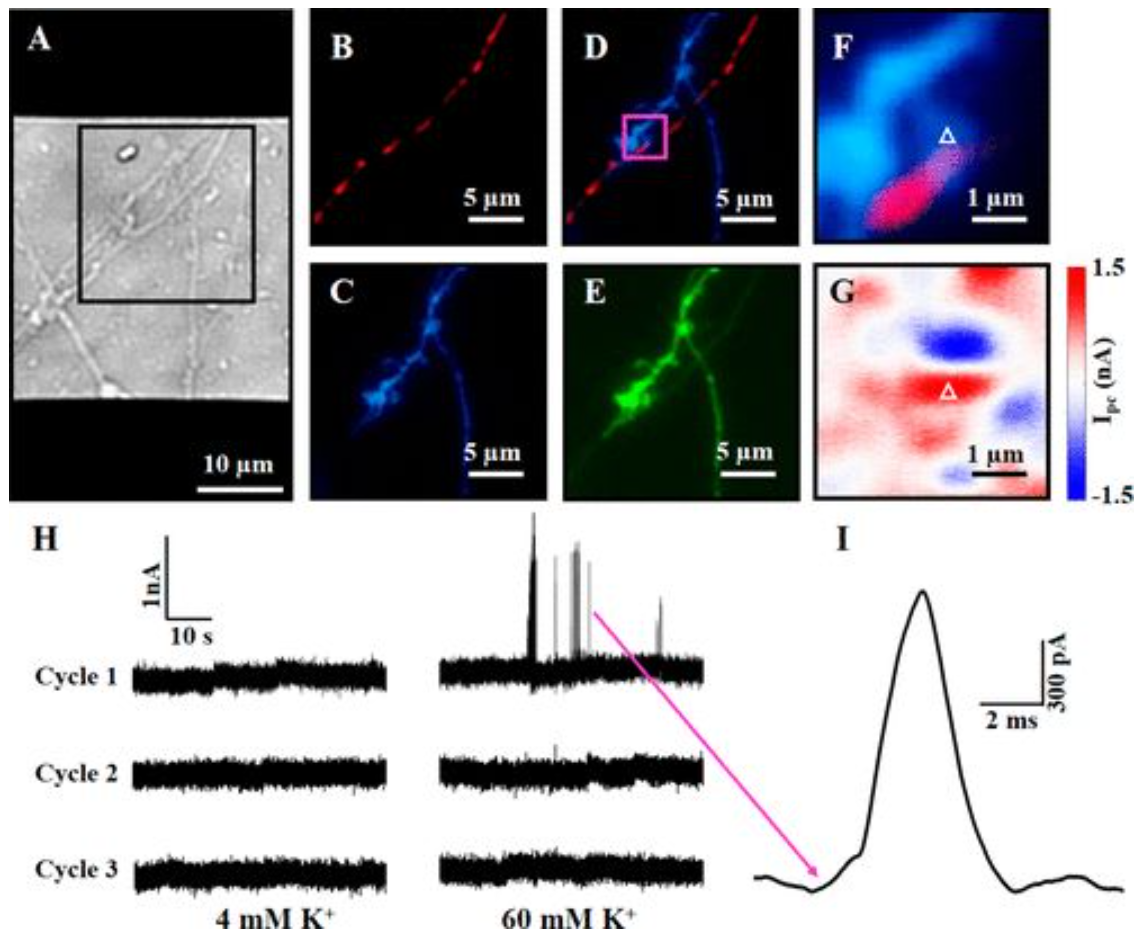
image6.(A)In the cultivation of9Heaven, the neuron shaped structure on top of the graphene transistorDICImage. (B)mCherry-Synaptosin (red);(C)mCeruleanblue;(D)mCeruleanandmCherry-synaptophysinThe superposition;And(E)GFP-GCaMP6s(Green). (F)PartialDDetailed fluorescence and(G)Photocurrent image. (H)Three highK +Graphene under stimulation cycle-Synaptic connection points (partially)FandGThe photocurrent response of the white triangle in the middle(4)-60-4-60-4-60). (I)PartialHThe spontaneous waveform of the spike pulse indicated by the magenta arrow in the middle.