-
E-mail
info@excipolar.com
-
Phone
15395560171
-
Address
Building 5, Chuangyan Port, Changzhou Science and Education City, No. 18-50 Changwu Middle Road, Wujin District, Changzhou City, Jiangsu Province, China
Changzhou Puguang Huilian Technology Co., Ltd
Application of Excipolar Spinos_Transient Absorption Spectroscopy
Date: 2025-11-17Read: 4
transient absorptionspectrum
Using two ultra short pulses, one with higher energy as pump light to excite sample particles to an excited state, causing some particles to transition from the ground state to the excited state, resulting in a change in the absorption characteristics of the material; Another pulse is focused on a nonlinear crystal to generate supercontinuum white light as the detection light. Subsequently, the probe light is incident on the sample at different time delays relative to the pump light. By detecting the difference in absorption or reflection of the probe light by the excited material at different delay times, the ultrafast dynamics of charge carriers can be obtained. This method can effectively analyze ultrafast processes such as electronic transitions, carrier relaxation, and energy transfer.
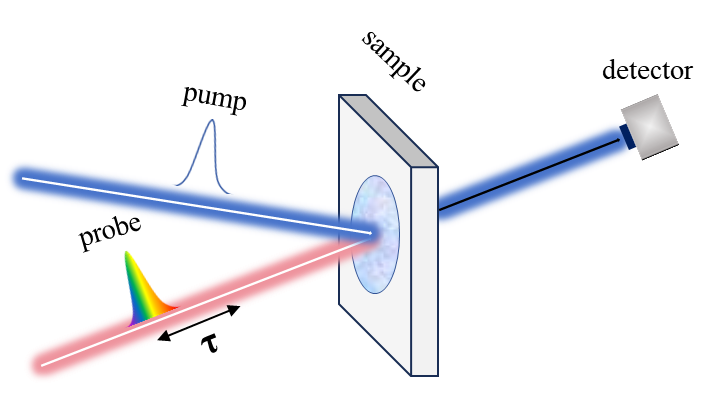
image1 transient absorptionschematic diagram
transientabsorbSpectral applications
1.Organic solar cells(OSCs)
Used for channel differentiation, rate and yield quantification, receptor and process screening, loss mechanism identification, and correlation between morphology and energy level driving force and device performance. For example, using transient absorption to monitor donors/Ground state bleaching of receptors(GSB)Excited state absorption(ESA)Charge induced absorption(CIA)Over time, it is possible to clearly distinguish between excitons and interfacesCTThree types of channels: state free charge; In addition, exciton dissociation and electrons were obtained through global fitting/Hole transferCTThe time constant and yield of state separation and feedback recombination are used to determine the rate limiting step; Combining different receptors, ratios, and annealing/Comparison of additive conditions, rapid screening of efficient systems, and identification of homogeneity through flux dependence/Non radiative losses such as heterodyne recombination and trap capture; Quantify the effects of phase separation scale, orientation crystallinity, and energy level mismatch on dissociation and separation probability, and compare the obtained kinetic parameters withEQEThePLQuenching andJ–VBehavioral correspondence, guidance for improvementJscTheVocandFF.(Reference:Tanget al.,Common Night 16, 1784 (2025))
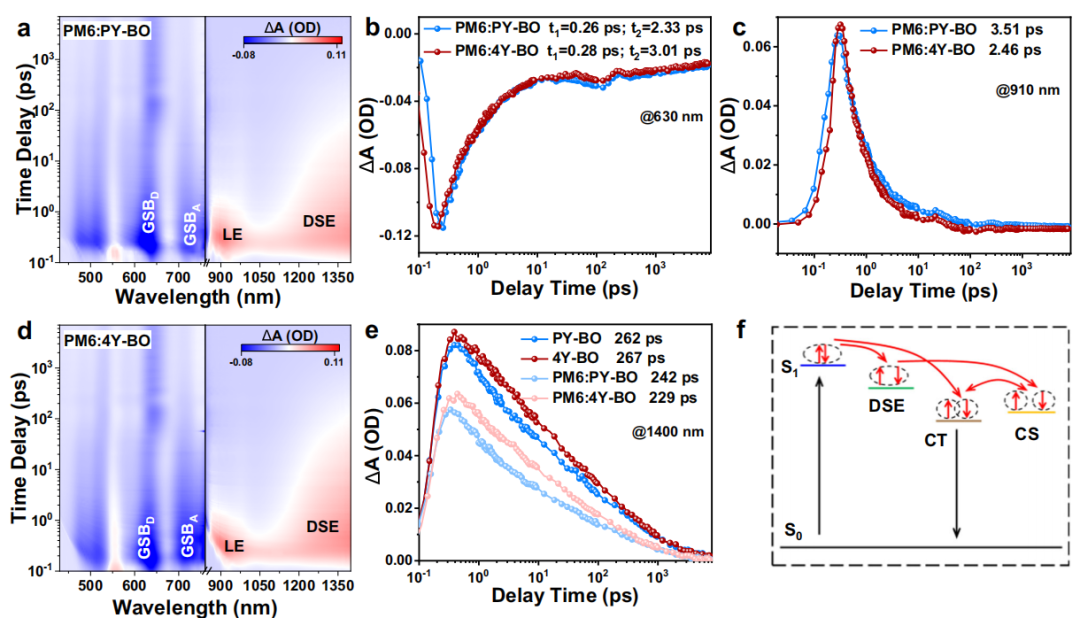
image2. Study on Charge Transfer Dynamics in Organic Solar Cells by Femtosecond Transient Absorption
2.quantum dot
Carrier generation and loss channels, interface charge separation efficiency, and energy level matching. For example, using femtosecond pumping-Detecting and monitoring ground state bleaching/The evolution of photoinduced absorption with delay can distinguish exciton decay from electron decay/Hole transfer across interfaces and in intrinsic CsPbBr₃Quantum dots have fewer detection traps and a lifetime of nanoseconds; In systems with electron acceptors or hole acceptors, transfer and recombination at the picosecond level and nanosecond level can be read out to evaluate the charge separation yield and interface energy level matching. In addition, multi excitons can be identified through flux dependence and global fitting/AugerContribute and compare the rate constant withPLquantum efficiency/Corresponding device performance is established to quantify interface engineering effects.(Reference:Chemet al.,Soc. 2015, 137, 40, 12792-12795)
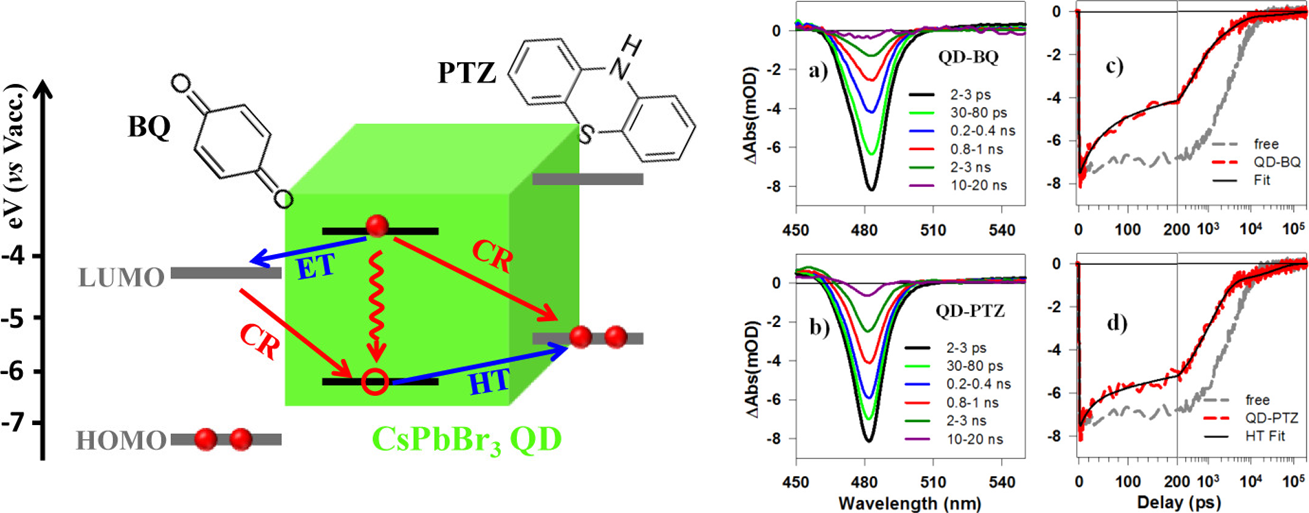
image3. CsPbBr3Energy level diagram (left);QD-BQandQD-PTZComposite ofTASpectrum and motionMechanics (right)
3.catalysis
In photocatalytic systems, femtosecond transient absorption(TA)Used to analyze the charge transfer dynamics from excitation to nanosecond scale, distinguish band edges from high-energy (hot carrier) paths, and use spectral fingerprinting(GSB/ESA/CIA)Quantitatively obtain electrons/Hole injection rate kinjReturn rate kbackSeparation lifespan TsepThese rate constants are related to the apparent quantum yield/Selective establishment of comparable controls can locate speed limiting and loss channels (such as even recombination and trap capture), thereby guiding energy level matching and coupling strength/Optimization of ligand engineering and light source spectra to achieve engineering improvements in reaction pathways and catalytic efficiency.(Reference:Sophieet al,Common Night 13, 845 (2022))
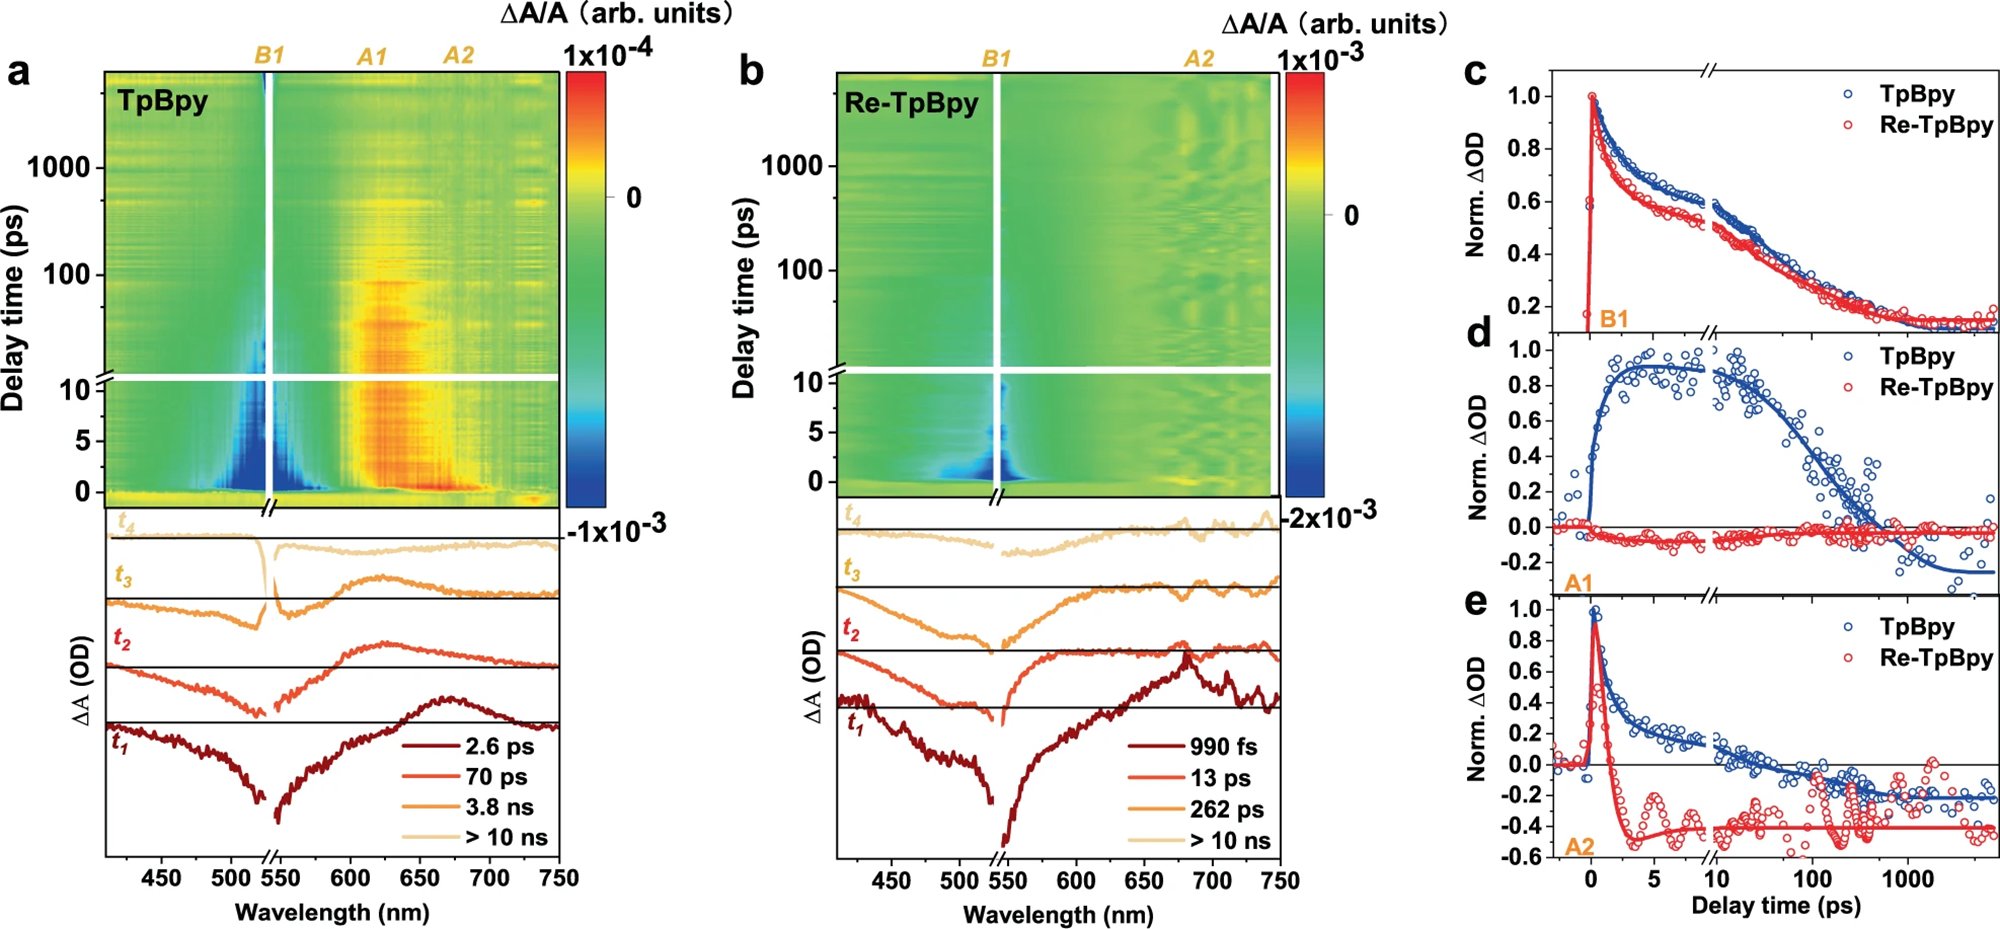
image4. In530 nmStimulated, give TpBpy andRe-TpBpy ofTASpectrum andSVDfitting
4.Two dimensional layered materials
Transient absorption(TA)Provide intuitive quantification of ultrafast dynamics for two-dimensional layered materials: distinguish exciton cooling and dissociation, intra layer at femtosecond nanosecond scales/Inter layer charge and energy transfer, and measurement of lifetime, transfer kinetics constant, and non radiative recombination/Trap ratio; By comparing different layers, stacking methods, and heterojunctions, the influence of interlayer coupling and energy level matching on carrier separation and return can be evaluated; By combining power and temperature dependence, it is also possible to identify multibody effects (such as triplet excitons, exciton phonon coupling) and diffusion length changes, providing executable mechanistic basis for thickness engineering, interface design, and environmental packaging optimization.(Reference:QinYet al.,OptIt's easy. 50, 4902-4905 (2025))

image5. 400 nmUnder stimulationCuCrP2S6nanosheetTAspectrum
5.biomolecule
Excited state channels, conformational response, and microenvironmental effects. For example, for photosynthetic complexes, rhodopsin, and porphyrins/Hemoglobin and other chromophores, transient absorption through monitoring ground state bleaching(GSB)/Stimulated emission(SE)/Excited state absorption(ESA)Over time, distinguish singlet, triplet, and free radical intermediates, and quantify energy/The lifetime and rate of electron transfer and conformational relaxation; In addition, the triplet formation and reactive oxygen species (such as ¹) of photosensitizers in cells and tissues can be evaluated without labelingO₂) Precursors and characterization of drug protein binding/Dissociation and phototoxicity risks. Through flux dependence and global fitting, in aerobic conditions/By comparing under deoxygenation conditions and using spectral shape and sign criteria, the triplet quantum yield, free radical yield, and transfer efficiency can be obtained, thereby establishing a time-resolved causal relationship between molecular structure and biological function.(Reference:Botaoet al.,Nano Today,47: 101681 (2022))

image6. Schematic diagram of artificial photosynthesis system for carbon dioxide fixation and high value-added chemical production (left); Low biotoxicity quantum dots were introduced into non photosynthetic bacteria to construct an artificial photosynthesis system. This system can achieve efficient conversion of carbon dioxide to acetic acid, and the light utilization efficiency of the entire process can reach6%The above. Transient absorption spectra and attenuation kinetics results of different systems (right)
6.Chemical reaction mechanism
Identification of reaction intermediates, channel differentiation, and extraction of rate constants. For example, transient absorption is monitored throughGSB/ESA/SEThe time-frequency spectrum directly captures free radicals and excited complexes at the femtosecond nanosecond scale(exciplex)TheCTShort life intermediates such as states, distinguishing parallelism/Tandem reaction pathway and forward transfer feedback composite; Using flux, wavelength, solvent and temperature dependence, and global fitting, quantify electrons/energy/Proton coupled transfer(PCET)The speed, branching ratio, and lifespan are determined byArrheniusorEyringRelationship estimation activation energy/Enthalpy entropy term; Simultaneously combining isotope substitution and polarity/The viscosity effect is used to determine the contributions of solvent cage effect, diffusion confinement, and trap trapping, thereby establishing a time-resolved causal relationship between the microscopic processes driven by light and the macroscopic quantum yield and selectivity.(Reference:Matthewet al.,Chemical science, 2022, 13(2): 486-496)

image7. 0.1 MAcetic acid buffer solution(pH 4.9)and0.2 MKClIn the system1.1 mM AQSThe transient absorption spectrum is displayed in the form of a pseudo color chart330 nmChanges in optical density caused by photoexcitation(ΔmOD)