-
E-mail
titan_market@bjjitian.com
-
Phone
18910230180
-
Address
Jiuxianqiao East Road, Chaoyang District, Beijing
Beijing Jitian Instrument Co., Ltd
Jitian Instrument Gas Chromatography Ion Mobility Spectroscopy GC-IMS Technology for Distinguishing Goji Berry Raw Pulp from Different Processes
Date: 2025-10-29Read: 0
Fresh goji berries have a high moisture content and are prone to spoilage, making them difficult to preserve. Therefore, most commercially available goji berry products are mainly processed deeply. Goji berry puree is made from fresh goji berries through processes such as grinding, homogenization, and sterilization. Goji berry puree can retain most of its nutritional components. In recent years, goji berry puree has become a mainstream deep processed product of goji berries. Similar to the processing methods of vegetable and fruit drinks, goji berry puree products are also divided into Non From Concentrate (NFC) goji berry puree and From Concentrate (FC) goji berry puree. Currently, there is also the use of dried fruit rehydrated goji berries to make goji berry puree. Different processing techniques and raw material sources can lead to differences in the nutritional quality and sensory flavor of goji berry pulp products.
This study used GC-IMS technology to analyze the flavor of 13 unknown processed goji berry raw materials. Relying on the standard library, industry library, and other proprietary libraries of GC-IMS 2000, complete the qualitative identification of volatile compounds. By using software with built-in data analysis methods such as principal component analysis and cluster analysis, different processing techniques of goji berry pulp were successfully distinguished. Further generate fingerprint maps to make the differences in flavor components between different processes more visually apparent.
1、 Experimental process
Experimental sample:Blind testing was conducted on 13 samples of goji berry pulp (numbered 1-13)
Pre processing:Accurately weigh 1g of sample, no pre-treatment required, directly sample on the headspace
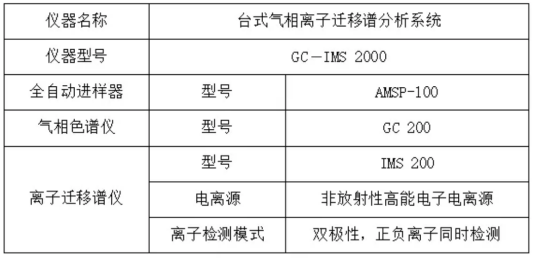
Instrument composition:

2、 Result analysis
1. Qualitative and quantitative analysis
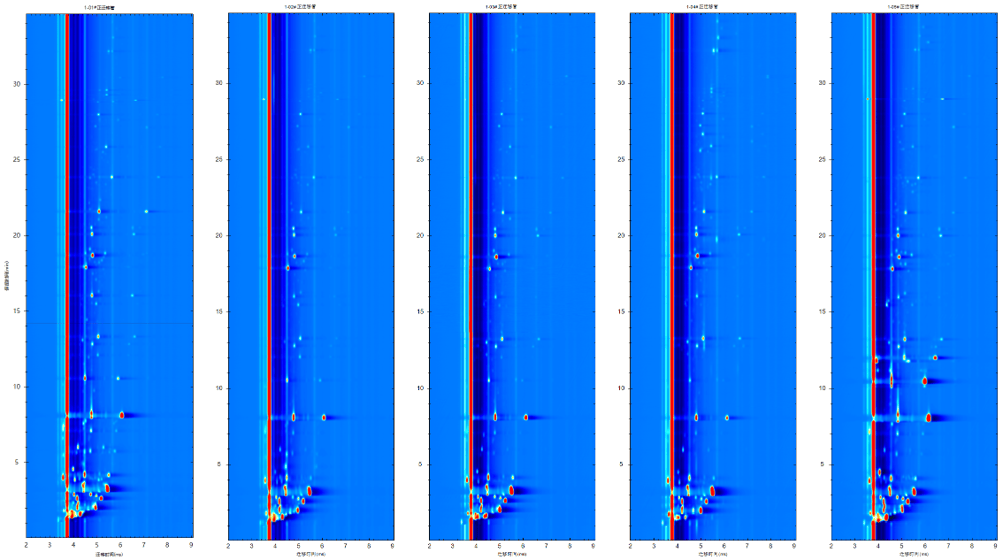
The original spectrum of some goji berry pulp is shown below. The peak shapes and response intensities of each component in the spectrum are good, and there is no obvious co outflow. GC-IMS 2000 can effectively separate volatile components from goji berry pulp.
Hundreds of components were detected in 13 different samples of goji berry pulp, and the components were qualitatively analyzed using GC-IMS 2000 proprietary library. The qualitative results include 24 ester compounds, 18 alcohol compounds, 18 aldehyde compounds, 8 ketone compounds, 6 acid compounds, 3 furan compounds, 3 olefin compounds, 3 sulfur-containing compounds, 1 ether compound, 1 pyrrole compound, 1 amine compound, and 1 pyrazine compound.
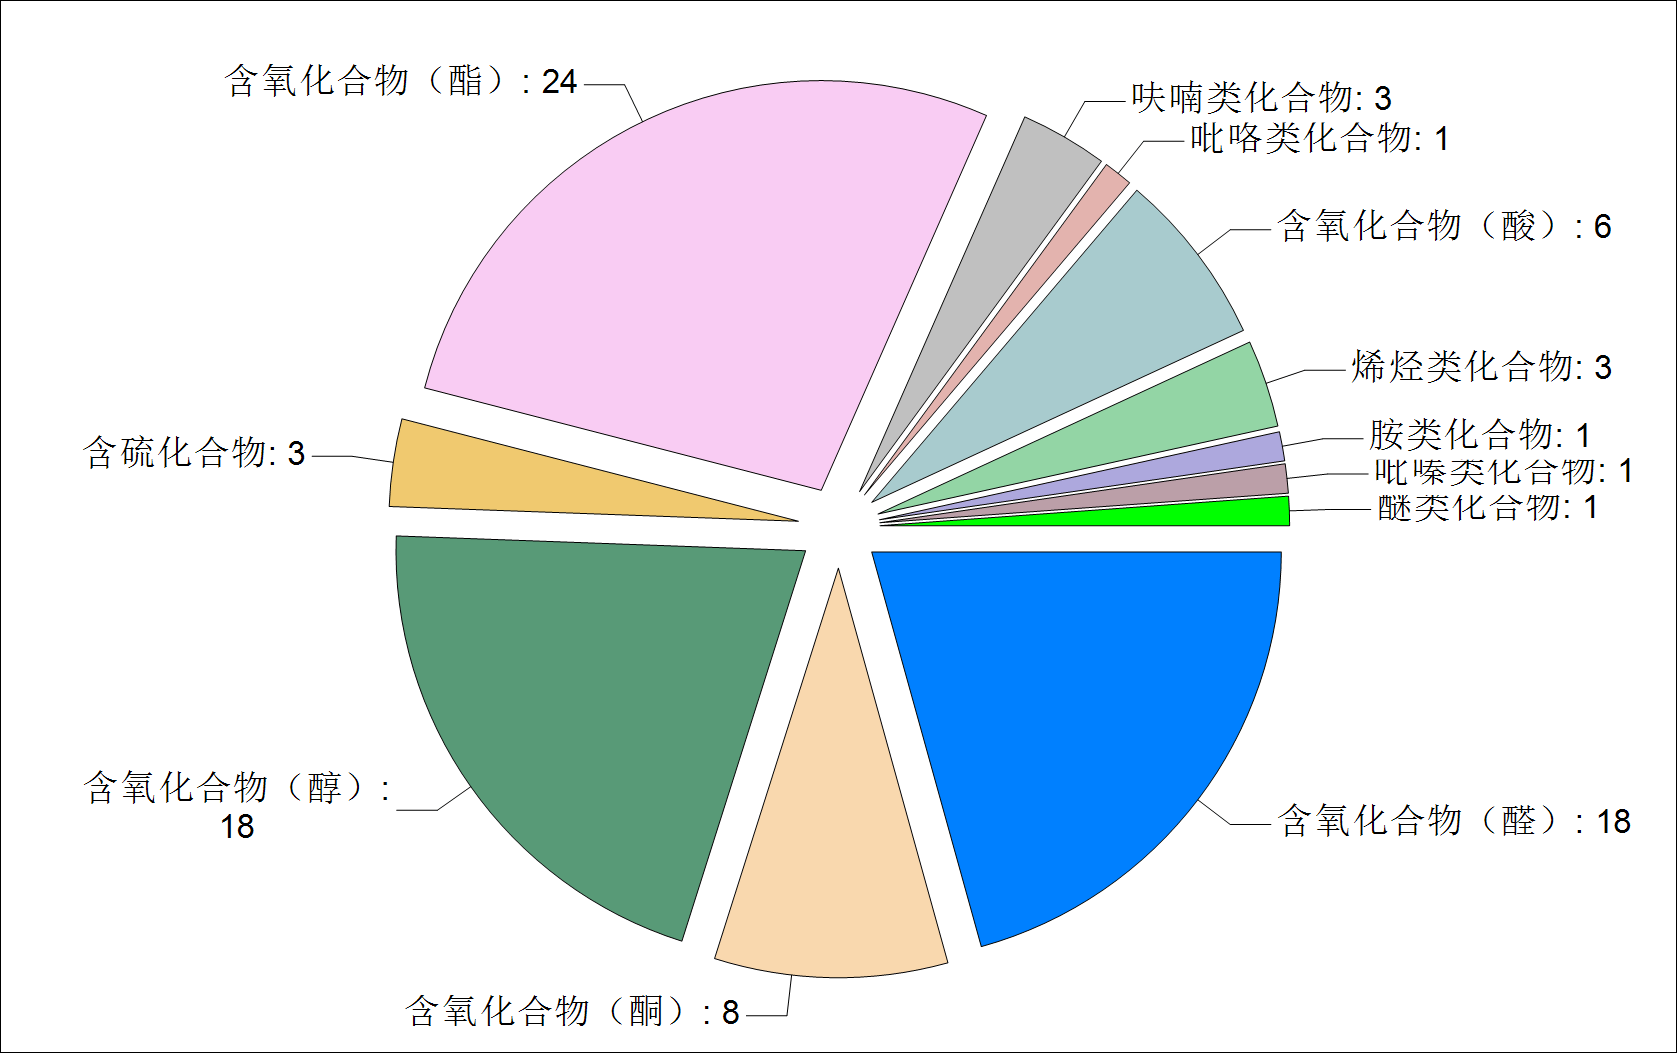
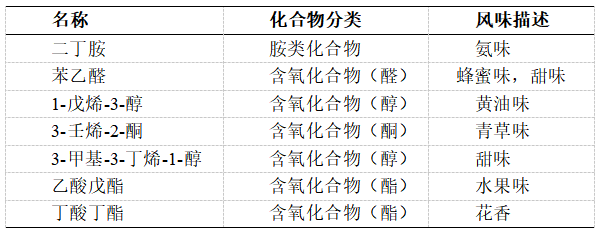
Table 1 Partial Qualitative Results
Among the main components of each sample, alcohol compounds account for the highest proportion (27.2%~46.1%), followed by aldehyde compounds (16.9%~27.9%), ester compounds (8.9%~20.3%), ketone compounds (6.8%~11.7%), acid compounds (2.3%~10.1%), and ether compounds (0.5%~9.2%). The proportion of furan compounds, sulfur-containing compounds, amine compounds, etc. is less than 5%. In samples 1 to 5, the proportion of amine compounds is around 2%, while the proportion of pyrazine compounds is relatively low. On the contrary, samples 6 to 13 contain almost no amine compounds, with pyrazine compounds accounting for about 2%.

2. Sample classification
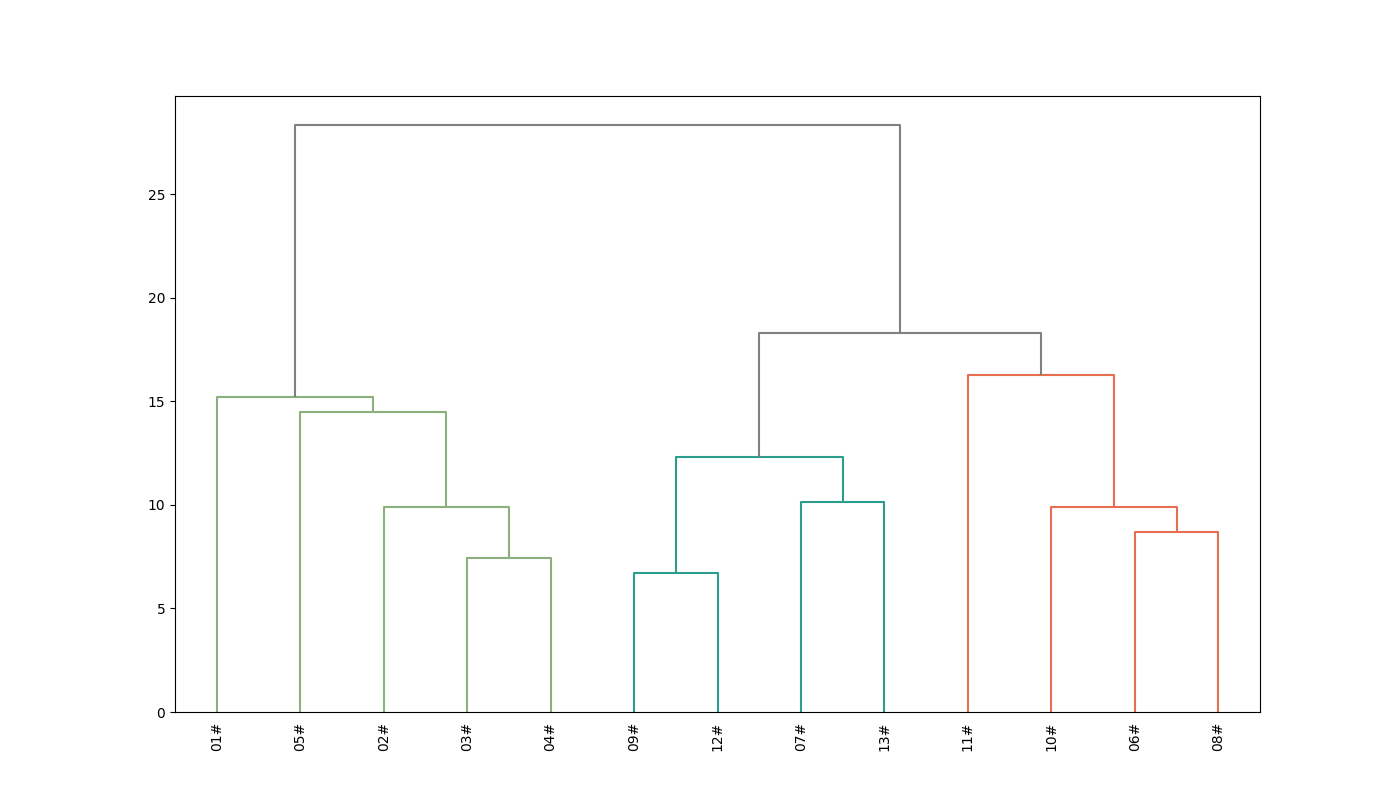
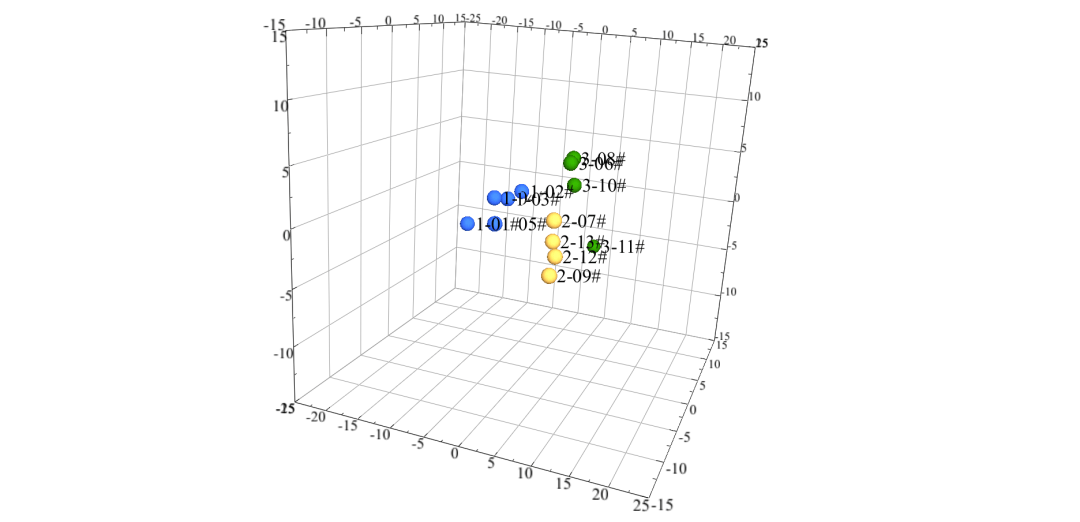
Simultaneously perform principal component analysis to obtain a three-dimensional PCA graph. The three principal components contain most of the original information and can represent the original data for interpretation. According to the PCA results, samples 1-5 have similarity, samples 7, 9, 12, and 13 have similarity, and samples 6, 8, 10, and 11 have similarity. The PCA results are consistent with the HCA results. Thirteen samples were divided into three categories.
3. Differential positioning
Compare the differences between samples and generate a difference spectrum using sample 1 as a reference. The distribution of spectral components in samples 2-5 is similar to that in sample 1, and the color difference is mainly due to the different concentrations of sample components. The distribution of spectral components in samples 6-13 shows significant differences in the low boiling point region compared to sample 1, mainly due to differences in component types.
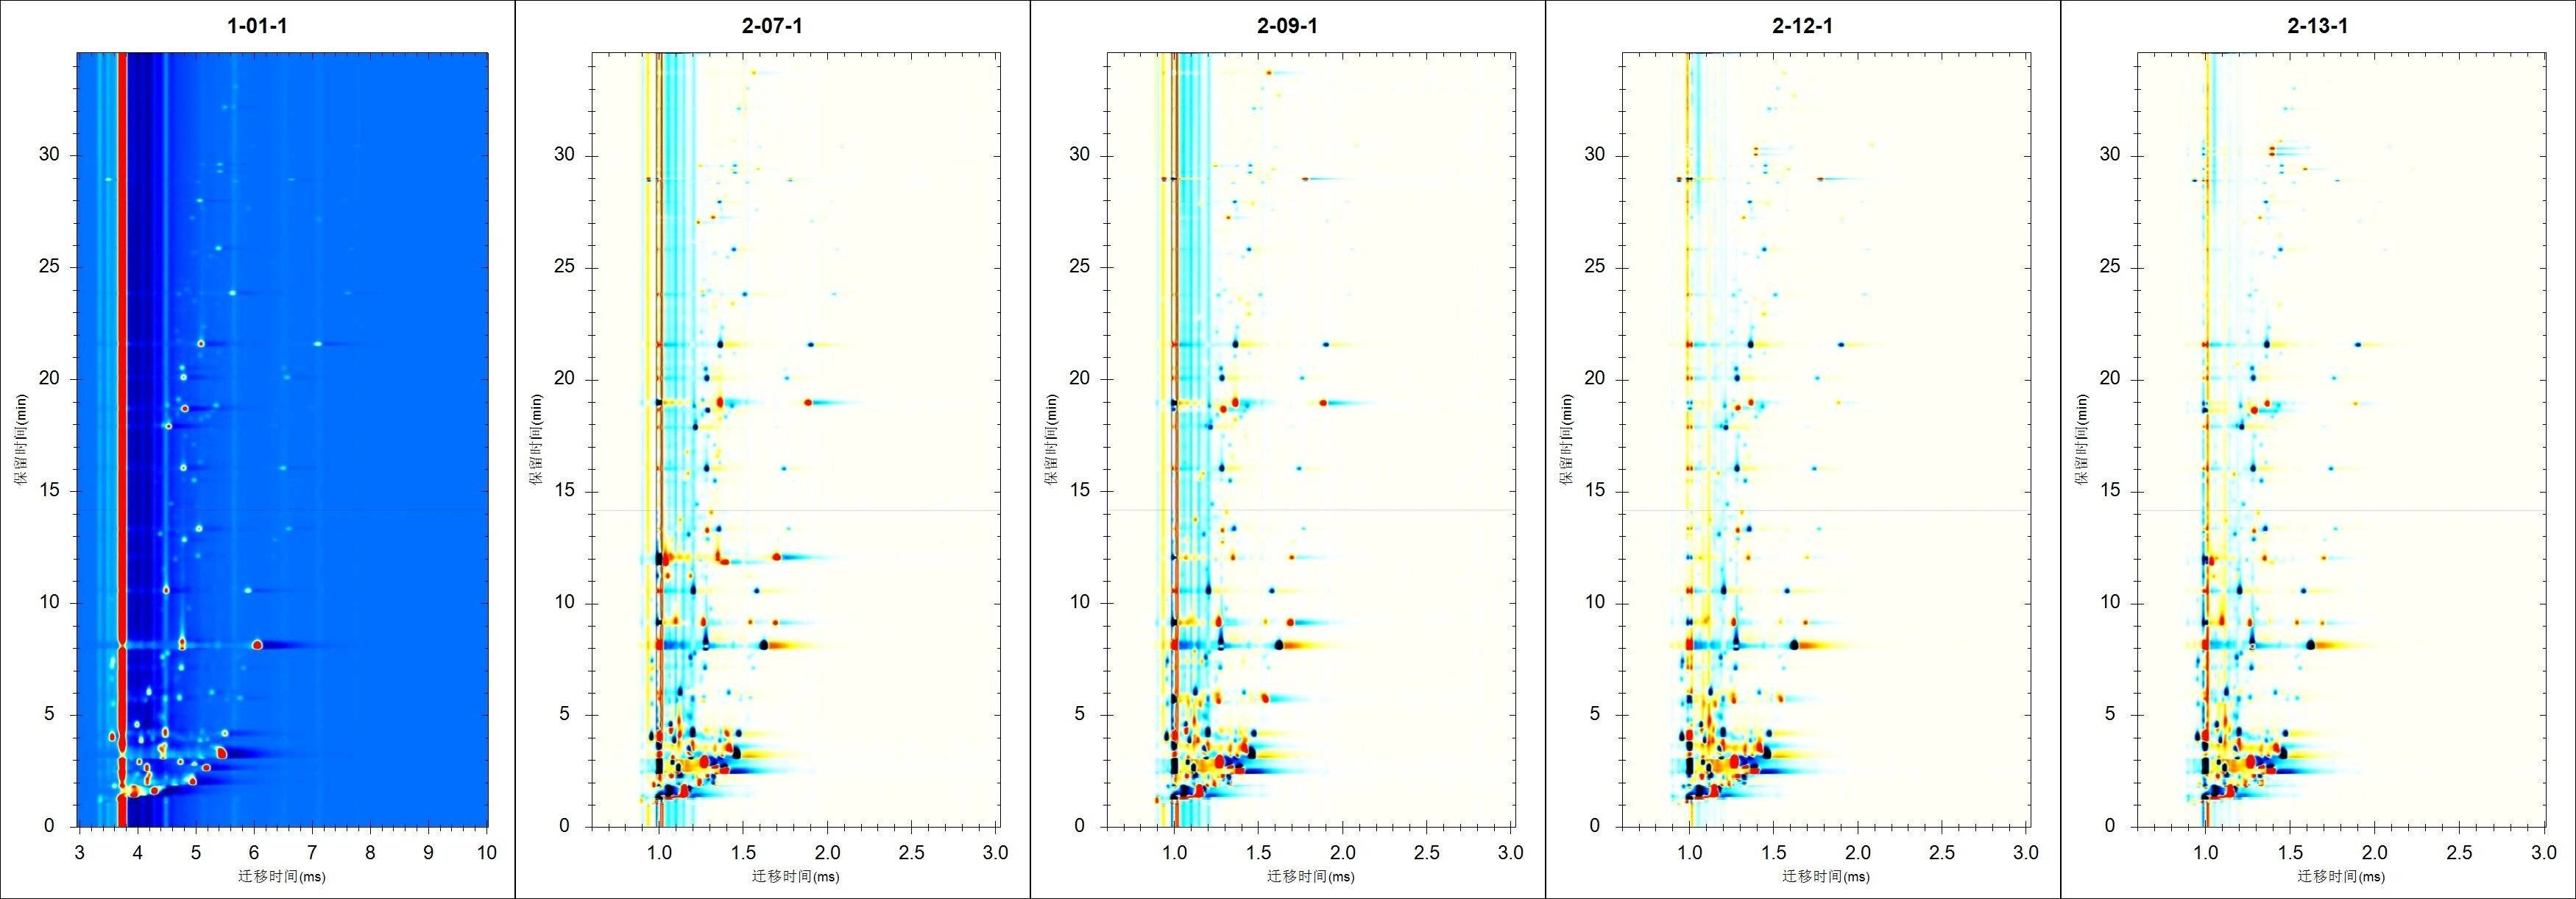
(Note: Red represents an increase in the number or concentration of components, while blue represents the opposite.)
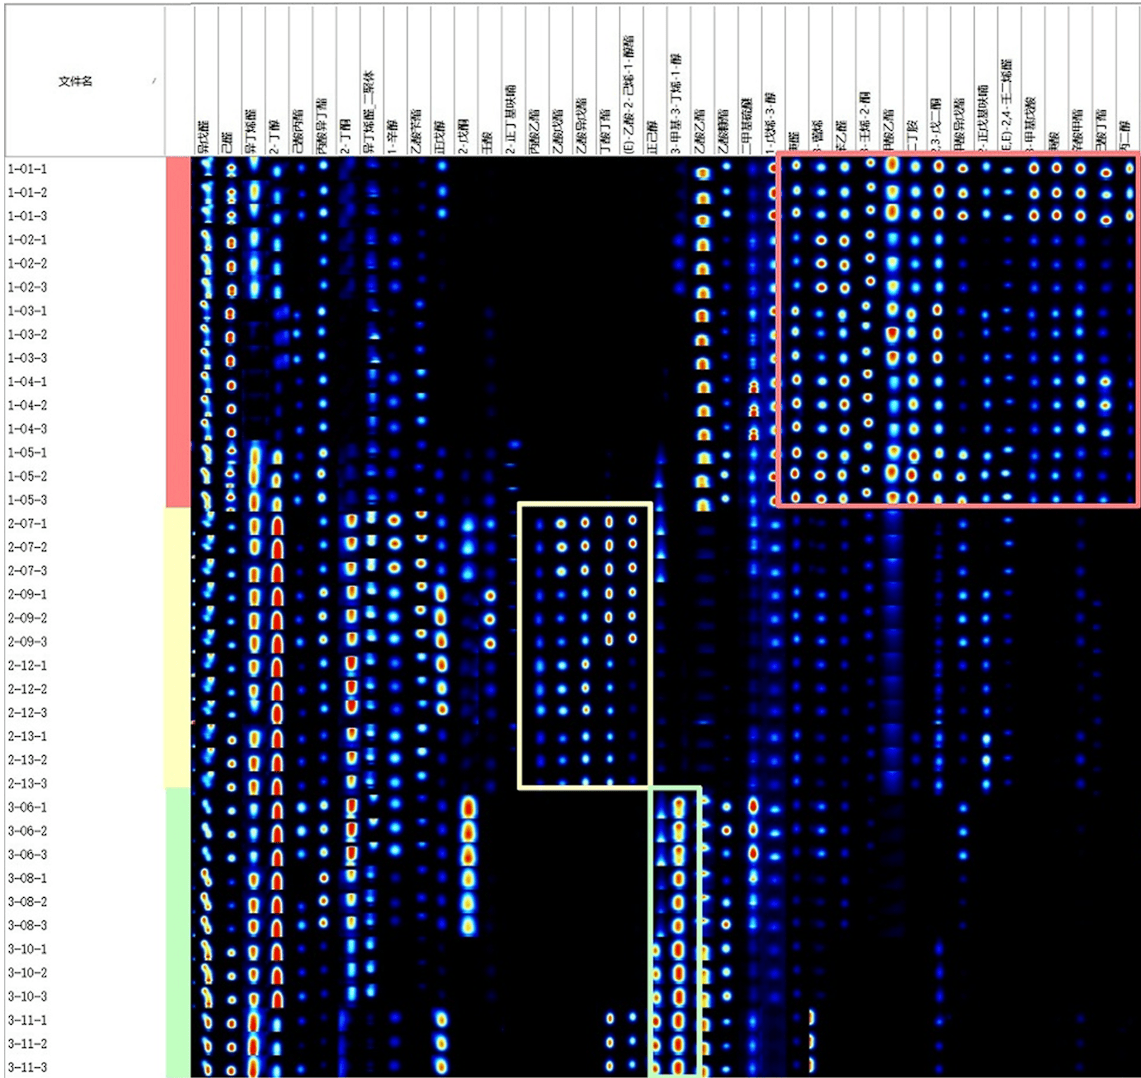
Further construct the fingerprint spectrum, and the components in the red box have higher content in samples 1-5, such as 1-penten-3-ol, phenylacetaldehyde, dibutylamine, etc; The components in the yellow box have higher contents in samples 7, 9, 12, and 13, such as pentyl acetate and butyl butyrate; The components in the green box have higher content in samples 6, 8, 10, and 11, such as 3-methyl-3-buten-1-ol.
GC-IMS 2000 equipped with self built and industry libraries can perform component analysis on unknown process goji berry raw pulp products. Based on the obtained spectral information, the use of multivariate analysis software can distinguish three types of processed goji berry pulp products. By combining differential analysis and visualization functions such as fingerprint maps, it is possible to accurately locate differences. Quickly complete the one-stop analysis of "sample loading data analysis spectrum drawing".